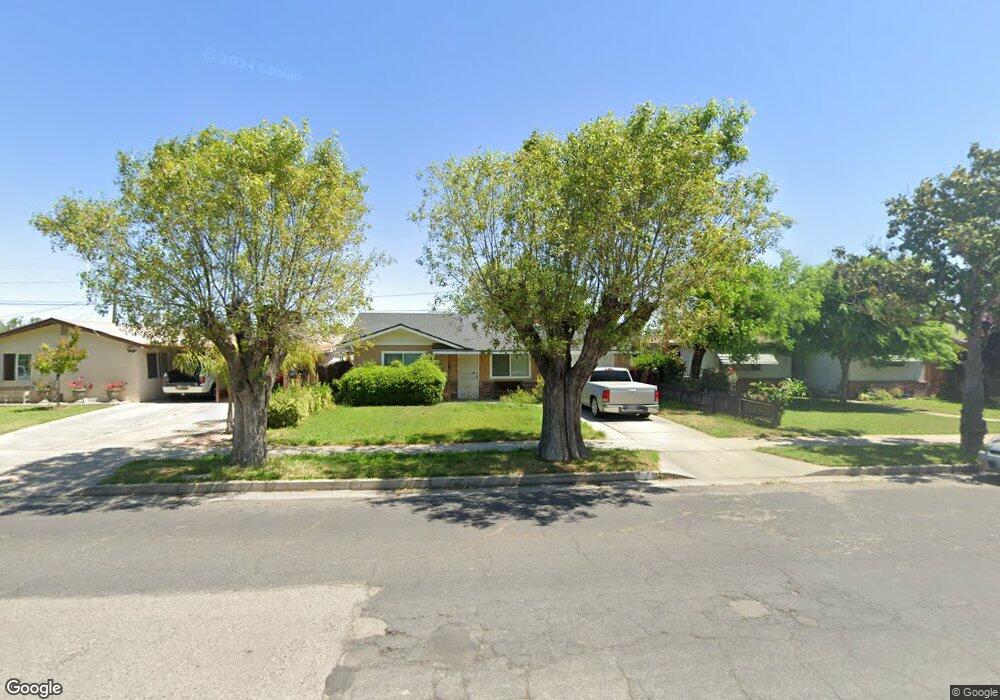
511 N G St Madera, CA 93637
Downtown Madera NeighborhoodEstimated Value: $278,000 - $336,000
2
Beds
1
Bath
966
Sq Ft
$308/Sq Ft
Est. Value
About This Home
This home is located at 511 N G St, Madera, CA 93637 and is currently estimated at $297,090, approximately $307 per square foot. 511 N G St is a home located in Madera County with nearby schools including James Madison Elementary School, Thomas Jefferson Middle School, and Madera High School.
Ownership History
Date
Name
Owned For
Owner Type
Purchase Details
Closed on
Nov 15, 2000
Sold by
Nino Daniel G and Nino Shannon M
Bought by
Lee Patrick
Current Estimated Value
Home Financials for this Owner
Home Financials are based on the most recent Mortgage that was taken out on this home.
Original Mortgage
$99,726
Outstanding Balance
$36,563
Interest Rate
7.81%
Mortgage Type
FHA
Estimated Equity
$260,527
Purchase Details
Closed on
Sep 28, 1998
Sold by
Jimenez Jose Luis and Jimenez Celia
Bought by
Nino Daniel G and Brown Shannon M
Home Financials for this Owner
Home Financials are based on the most recent Mortgage that was taken out on this home.
Original Mortgage
$85,868
Interest Rate
6.77%
Create a Home Valuation Report for This Property
The Home Valuation Report is an in-depth analysis detailing your home's value as well as a comparison with similar homes in the area
Home Values in the Area
Average Home Value in this Area
Purchase History
| Date | Buyer | Sale Price | Title Company |
|---|---|---|---|
| Lee Patrick | $100,000 | -- | |
| Nino Daniel G | $86,000 | Chicago Title Co |
Source: Public Records
Mortgage History
| Date | Status | Borrower | Loan Amount |
|---|---|---|---|
| Open | Lee Patrick | $99,726 | |
| Previous Owner | Nino Daniel G | $85,868 |
Source: Public Records
Tax History
| Year | Tax Paid | Tax Assessment Tax Assessment Total Assessment is a certain percentage of the fair market value that is determined by local assessors to be the total taxable value of land and additions on the property. | Land | Improvement |
|---|---|---|---|---|
| 2025 | $1,762 | $150,508 | $30,125 | $120,383 |
| 2023 | $1,762 | $144,665 | $28,956 | $115,709 |
| 2022 | $1,647 | $141,830 | $28,389 | $113,441 |
| 2021 | $1,617 | $139,050 | $27,833 | $111,217 |
| 2020 | $1,646 | $137,625 | $27,548 | $110,077 |
| 2019 | $1,540 | $126,996 | $25,808 | $101,188 |
| 2018 | $1,449 | $126,996 | $25,808 | $101,188 |
| 2017 | $1,392 | $120,948 | $25,531 | $95,417 |
| 2016 | $1,344 | $118,576 | $25,030 | $93,546 |
| 2015 | $1,294 | $113,881 | $24,790 | $89,091 |
| 2014 | $1,130 | $104,478 | $24,578 | $79,900 |
Source: Public Records
Map
Nearby Homes
Your Personal Tour Guide
Ask me questions while you tour the home.