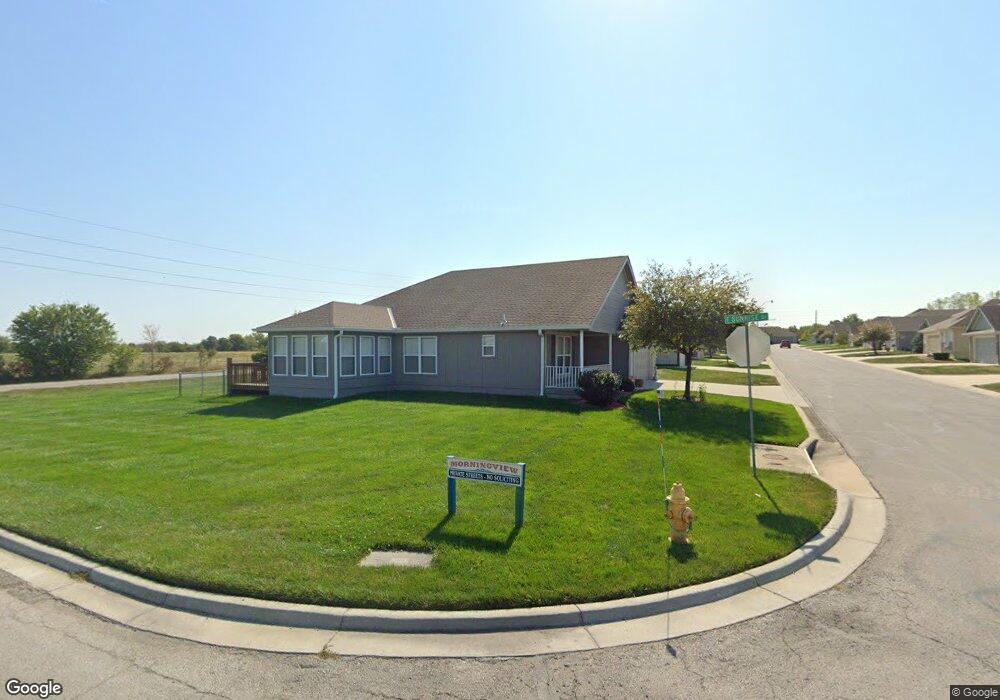
511 Neptune Dr Raymore, MO 64083
Estimated Value: $278,000 - $303,000
2
Beds
2
Baths
1,524
Sq Ft
$189/Sq Ft
Est. Value
About This Home
This home is located at 511 Neptune Dr, Raymore, MO 64083 and is currently estimated at $287,554, approximately $188 per square foot. 511 Neptune Dr is a home located in Cass County with nearby schools including Raymore Elementary School, Raymore-Peculiar East Middle School, and Raymore-Peculiar Senior High School.
Ownership History
Date
Name
Owned For
Owner Type
Purchase Details
Closed on
May 21, 2010
Sold by
Rinehart Stanley A and Rinehart Salley A
Bought by
Morrison Ruth A and Harold E Morrison And Ruth A Morrison Tr
Current Estimated Value
Purchase Details
Closed on
Oct 27, 2009
Sold by
Rinehart Stanley A
Bought by
Rinehart Stanley A and Rinehart Sally A
Purchase Details
Closed on
Nov 8, 2005
Sold by
Jjm Investment Corp
Bought by
Beane Edna
Purchase Details
Closed on
Aug 25, 2005
Sold by
Mcgovern Brothers Homes Llc
Bought by
Jjm Investment Corp
Home Financials for this Owner
Home Financials are based on the most recent Mortgage that was taken out on this home.
Original Mortgage
$125,143
Interest Rate
5.78%
Mortgage Type
Construction
Purchase Details
Closed on
Aug 15, 2005
Sold by
T K W Construction Inc
Bought by
Mcgovern Brothers Homes Llc
Home Financials for this Owner
Home Financials are based on the most recent Mortgage that was taken out on this home.
Original Mortgage
$125,143
Interest Rate
5.78%
Mortgage Type
Construction
Create a Home Valuation Report for This Property
The Home Valuation Report is an in-depth analysis detailing your home's value as well as a comparison with similar homes in the area
Home Values in the Area
Average Home Value in this Area
Purchase History
| Date | Buyer | Sale Price | Title Company |
|---|---|---|---|
| Morrison Ruth A | -- | -- | |
| Rinehart Stanley A | -- | None Available | |
| Beane Edna | -- | -- | |
| Jjm Investment Corp | -- | -- | |
| Mcgovern Brothers Homes Llc | -- | -- |
Source: Public Records
Mortgage History
| Date | Status | Borrower | Loan Amount |
|---|---|---|---|
| Previous Owner | Jjm Investment Corp | $125,143 | |
| Previous Owner | Mcgovern Brothers Homes Llc | $315,355 |
Source: Public Records
Tax History
| Year | Tax Paid | Tax Assessment Tax Assessment Total Assessment is a certain percentage of the fair market value that is determined by local assessors to be the total taxable value of land and additions on the property. | Land | Improvement |
|---|---|---|---|---|
| 2025 | $2,584 | $35,550 | $5,480 | $30,070 |
| 2024 | $2,584 | $31,750 | $4,980 | $26,770 |
| 2023 | $2,580 | $31,750 | $4,980 | $26,770 |
| 2022 | $2,290 | $27,990 | $4,980 | $23,010 |
| 2021 | $2,290 | $27,990 | $4,980 | $23,010 |
| 2020 | $2,307 | $27,700 | $4,980 | $22,720 |
| 2019 | $2,228 | $27,700 | $4,980 | $22,720 |
| 2018 | $2,048 | $24,600 | $4,050 | $20,550 |
| 2017 | $1,875 | $24,600 | $4,050 | $20,550 |
| 2016 | $1,875 | $23,370 | $4,050 | $19,320 |
| 2015 | $1,876 | $23,370 | $4,050 | $19,320 |
| 2014 | $1,752 | $21,810 | $2,490 | $19,320 |
| 2013 | -- | $21,810 | $2,490 | $19,320 |
Source: Public Records
Map
Nearby Homes
- 522 Neptune Dr
- Lot 12 Municipal Cir
- Lot 6 Municipal Cir
- Lot 13 Municipal Cir
- 702 Twilight Ct
- 515 S Saturn Dr
- 528 S Saturn Dr
- 0 Missouri 58
- 720 Sandpiper St
- 305 E Olive St
- 405 S Monroe St
- 503 S Harrison Ave
- 211 S Franklin St
- 605 S Franklin St
- 506 S Adams St
- 804 S Washington St
- 219 Pointe Ln
- 221 N Pointe Ln
- 204 N Pointe Ln
- 709 Derby St
Your Personal Tour Guide
Ask me questions while you tour the home.