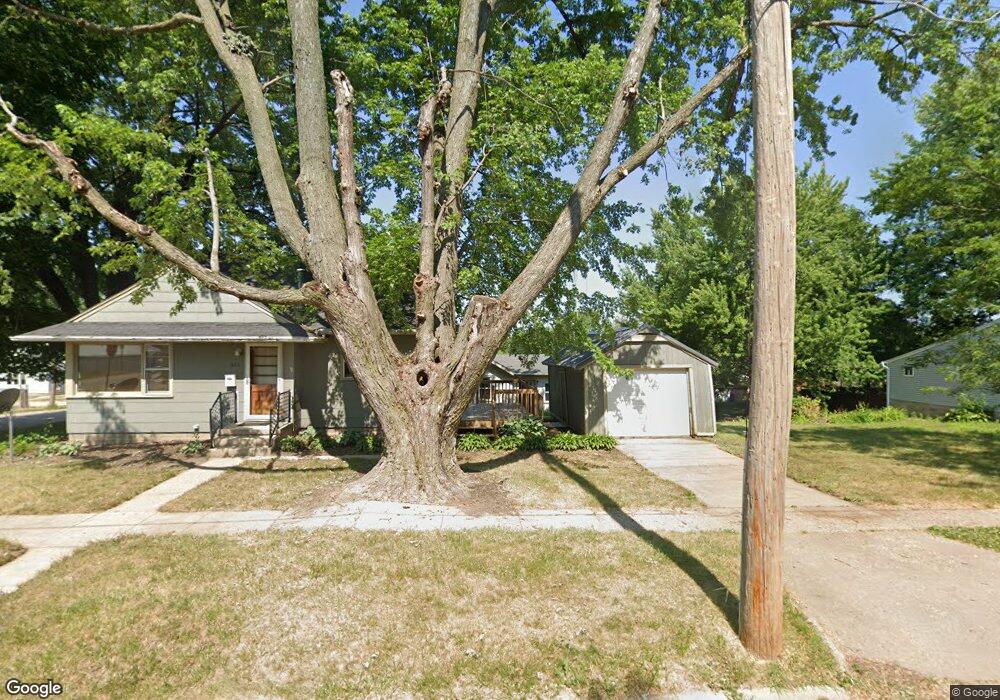
511 S Grape St Morrison, IL 61270
Estimated Value: $85,000 - $118,000
3
Beds
1
Bath
1,140
Sq Ft
$92/Sq Ft
Est. Value
About This Home
This home is located at 511 S Grape St, Morrison, IL 61270 and is currently estimated at $104,478, approximately $91 per square foot. 511 S Grape St is a home located in Whiteside County with nearby schools including Northside School, Southside School, and Morrison Junior High School.
Ownership History
Date
Name
Owned For
Owner Type
Purchase Details
Closed on
Apr 25, 2008
Sold by
Emc Mortgage Corporation
Bought by
Kenady Kevin and Kenady Lynn
Current Estimated Value
Home Financials for this Owner
Home Financials are based on the most recent Mortgage that was taken out on this home.
Original Mortgage
$70,000
Interest Rate
5.88%
Mortgage Type
Unknown
Purchase Details
Closed on
Feb 7, 2008
Sold by
Hudson Chad and Hudson Chad M
Bought by
Emc Mortgage Corporation
Create a Home Valuation Report for This Property
The Home Valuation Report is an in-depth analysis detailing your home's value as well as a comparison with similar homes in the area
Home Values in the Area
Average Home Value in this Area
Purchase History
| Date | Buyer | Sale Price | Title Company |
|---|---|---|---|
| Kenady Kevin | $64,500 | None Available | |
| Emc Mortgage Corporation | -- | None Available |
Source: Public Records
Mortgage History
| Date | Status | Borrower | Loan Amount |
|---|---|---|---|
| Closed | Kenady Kevin | $70,000 |
Source: Public Records
Tax History
| Year | Tax Paid | Tax Assessment Tax Assessment Total Assessment is a certain percentage of the fair market value that is determined by local assessors to be the total taxable value of land and additions on the property. | Land | Improvement |
|---|---|---|---|---|
| 2024 | $2,212 | $27,121 | $2,261 | $24,860 |
| 2023 | $2,062 | $24,691 | $2,058 | $22,633 |
| 2022 | $1,937 | $22,930 | $1,911 | $21,019 |
| 2021 | $1,887 | $22,454 | $1,871 | $20,583 |
| 2020 | $1,922 | $22,879 | $1,906 | $20,973 |
| 2019 | $1,976 | $23,291 | $1,575 | $21,716 |
| 2018 | $2,053 | $23,187 | $1,568 | $21,619 |
| 2017 | $1,907 | $22,274 | $1,506 | $20,768 |
| 2016 | $1,831 | $21,484 | $1,453 | $20,031 |
| 2015 | $1,920 | $22,008 | $1,488 | $20,520 |
| 2014 | $191 | $21,759 | $1,471 | $20,288 |
| 2013 | $1,920 | $22,008 | $1,488 | $20,520 |
Source: Public Records
Map
Nearby Homes
- 411 W Park St
- 306 S Heaton St
- 406 S Genesee St
- 308 S Genesee St
- 301 S Genesee St
- 109 E Morris St
- 509 S Madison St
- 302 E Park St
- 402 W Lincolnway
- 617 W Lincolnway
- 814 W Park St
- 503 Portland Ave
- 105 E Knox St
- 403 E Park St
- 624 W Lincolnway
- 604 Hillandale Ct
- 418 E Wall St
- 503 E Main St
- 400 E Knox St
- 513 E Main St
- 402 W Winfield St
- 505 S Grape St
- 308 W Winfield St
- 503 S Grape St
- 403 W South St
- 406 W Winfield St
- 306 W Winfield St
- 405 W South St
- 401 W South St
- 500 S Grape St
- 405 W Winfield St
- 407 W South St
- 408 W Winfield St
- 307 W South St
- 305 W South St
- 407 W Winfield St
- 302 W Winfield St
- 409 S Grape St
- 500 S Hall St
- 412 S Grape St
Your Personal Tour Guide
Ask me questions while you tour the home.