Estimated Value: $91,000 - $141,000
About This Home
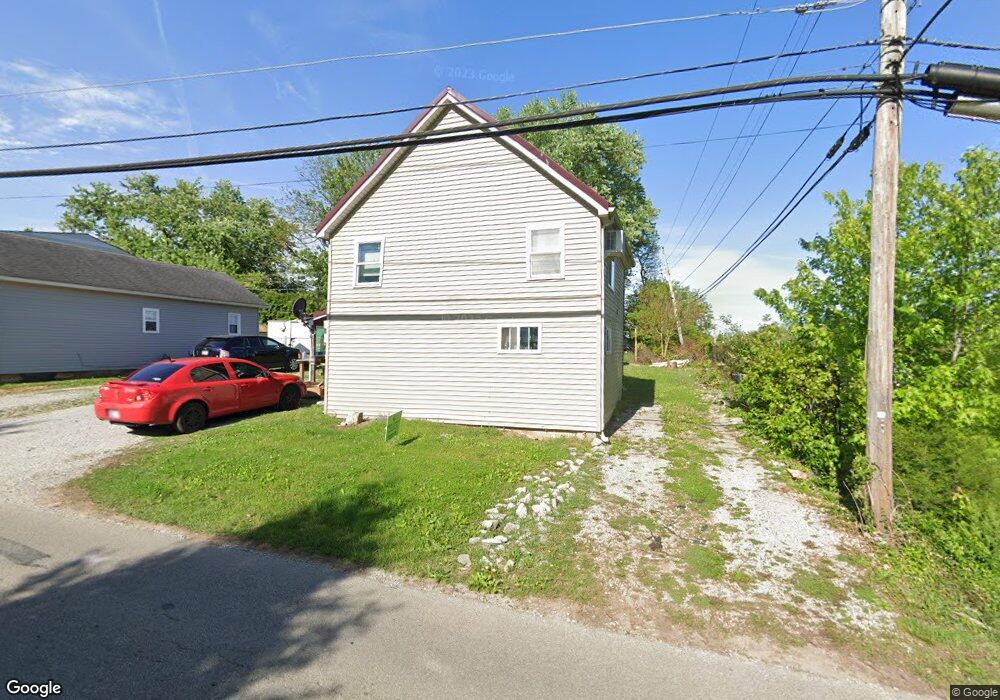
This home is located at 511 S High St, Salem, IN 47167 and is currently estimated at $118,053, approximately $147 per square foot. 511 S High St is a home located in Washington County with nearby schools including Bradie M. Shrum Lower Elementary School, Salem Middle School, and Salem High School.
Ownership History
We collect this data history from publicly available records. To have your information removed, we recommend requesting removal directly through your county’s website.
Purchase Details
Home Financials for this Owner
Home Financials are based on the most recent Mortgage that was taken out on this home.Home Values in the Area
Average Home Value in this Area
Purchase History
We collect this data history from publicly available records. To have your information removed, we recommend requesting removal directly through your county’s website.
| Date | Buyer | Sale Price | Title Company |
|---|---|---|---|
| -- | None Available |
Mortgage History
We collect this data history from publicly available records. To have your information removed, we recommend requesting removal directly through your county’s website.
| Date | Status | Borrower | Loan Amount |
|---|---|---|---|
| Closed | $45,500 | ||
| Closed | $15,707 |
Tax History
We collect this data history from publicly available records. To have your information removed, we recommend requesting removal directly through your county’s website.
| Year | Tax Paid | Tax Assessment Tax Assessment Total Assessment is a certain percentage of the fair market value that is determined by local assessors to be the total taxable value of land and additions on the property. | Land | Improvement |
|---|---|---|---|---|
| 2025 | $1,180 | $59,000 | $5,200 | $53,800 |
| 2024 | $730 | $36,500 | $5,200 | $31,300 |
| 2023 | $676 | $33,400 | $5,200 | $28,200 |
| 2022 | $602 | $29,700 | $5,200 | $24,500 |
| 2021 | $558 | $27,500 | $5,200 | $22,300 |
| 2020 | $582 | $28,700 | $5,200 | $23,500 |
| 2019 | $560 | $27,600 | $5,200 | $22,400 |
| 2018 | $271 | $25,500 | $5,200 | $20,300 |
| 2017 | $245 | $27,400 | $5,200 | $22,200 |
| 2016 | $195 | $25,400 | $5,200 | $20,200 |
| 2014 | $184 | $25,700 | $5,200 | $20,500 |
| 2013 | $163 | $24,300 | $5,200 | $19,100 |
Map
- 701 S Main St
- 205 Arthur St
- 406 S Posey St
- 412 Ridgeview Dr
- 11 Campbell Ct
- 203 S Mill St
- 301 E Market St
- 306 W Poplar St
- 0 Highland Dr Unit 202609879
- 807 Smith St
- 303 W Market St
- 500 W Mulberry St
- 409 N Water St
- 405 N Mill St
- 307 N Harrison St
- 500 N College Ave
- 402 Hayes Ave
- 507 N High St
- 506 N College Ave
- 701 E Hackberry St
Ask me questions while you tour the home.