511 S Main St Bluffton, OH 45817
Estimated Value: $216,514 - $291,000
3
Beds
2
Baths
1,496
Sq Ft
$169/Sq Ft
Est. Value
About This Home
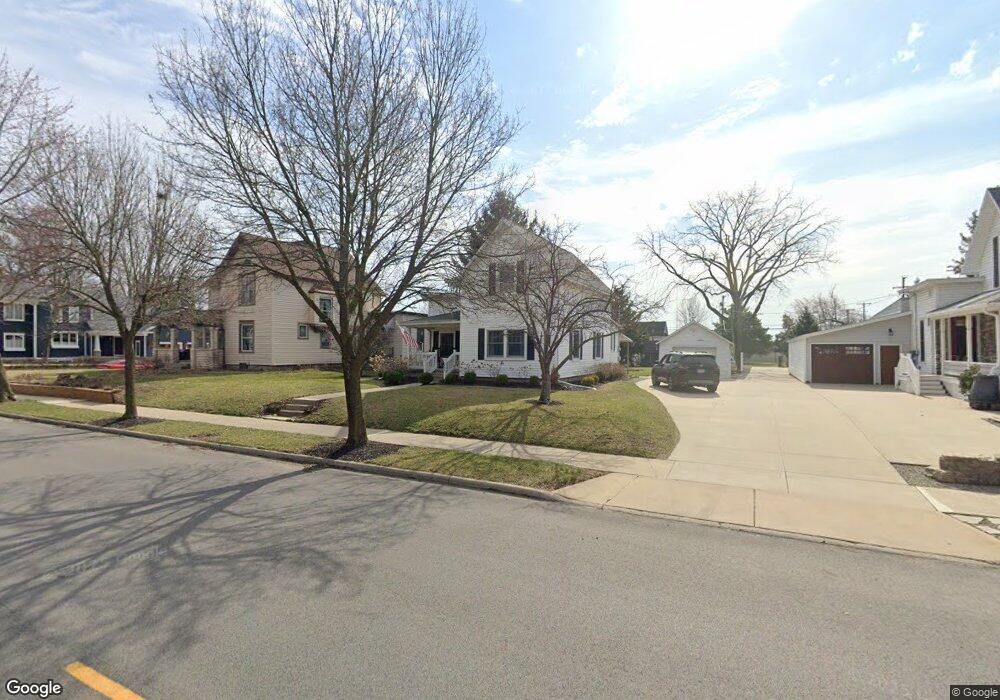
This home is located at 511 S Main St, Bluffton, OH 45817 and is currently estimated at $253,379, approximately $169 per square foot. 511 S Main St is a home located in Allen County with nearby schools including Bluffton Elementary School, Bluffton Middle School, and Bluffton High School.
Ownership History
Date
Name
Owned For
Owner Type
Purchase Details
Closed on
Sep 8, 1995
Sold by
Clark Mary
Bought by
Wenger Christopher and Wenger Rhonda
Current Estimated Value
Home Financials for this Owner
Home Financials are based on the most recent Mortgage that was taken out on this home.
Original Mortgage
$47,000
Interest Rate
7.76%
Mortgage Type
New Conventional
Purchase Details
Closed on
Sep 15, 1987
Bought by
Clark Mary Alice
Create a Home Valuation Report for This Property
The Home Valuation Report is an in-depth analysis detailing your home's value as well as a comparison with similar homes in the area
Home Values in the Area
Average Home Value in this Area
Purchase History
| Date | Buyer | Sale Price | Title Company |
|---|---|---|---|
| Wenger Christopher | $74,000 | -- | |
| Clark Mary Alice | $37,000 | -- |
Source: Public Records
Mortgage History
| Date | Status | Borrower | Loan Amount |
|---|---|---|---|
| Closed | Wenger Christopher | $47,000 |
Source: Public Records
Tax History
| Year | Tax Paid | Tax Assessment Tax Assessment Total Assessment is a certain percentage of the fair market value that is determined by local assessors to be the total taxable value of land and additions on the property. | Land | Improvement |
|---|---|---|---|---|
| 2024 | $1,880 | $56,910 | $13,790 | $43,120 |
| 2023 | $1,630 | $45,710 | $11,480 | $34,230 |
| 2022 | $1,646 | $45,710 | $11,480 | $34,230 |
| 2021 | $1,657 | $45,710 | $11,480 | $34,230 |
| 2020 | $1,518 | $37,870 | $10,990 | $26,880 |
| 2019 | $1,518 | $37,870 | $10,990 | $26,880 |
| 2018 | $1,417 | $37,870 | $10,990 | $26,880 |
| 2017 | $1,309 | $32,520 | $10,120 | $22,400 |
| 2016 | $1,321 | $32,520 | $10,120 | $22,400 |
| 2015 | $1,284 | $32,520 | $10,120 | $22,400 |
| 2014 | $1,284 | $30,700 | $9,800 | $20,900 |
| 2013 | $1,186 | $30,700 | $9,800 | $20,900 |
Source: Public Records
Map
Nearby Homes
- 513 S Jackson St
- 217 Grove St
- 301 Parkview Dr
- 303 Parkview Dr
- 305 Parkview Dr
- 218 S Jackson St
- 307 Parkview Dr
- 315 Parkview Dr
- 317 Parkview Dr
- 319 Parkview Dr
- 321 Parkview Dr
- 327 Parkview Dr
- 329 Parkview Dr
- 331 Parkview Dr
- 333 Parkview Dr
- 0 Columbus Grove-Bluffton Rd
- 408 Cherry St
- 160 Chestnut Ln
- 0 Ohio 103
- 210 N Jackson St