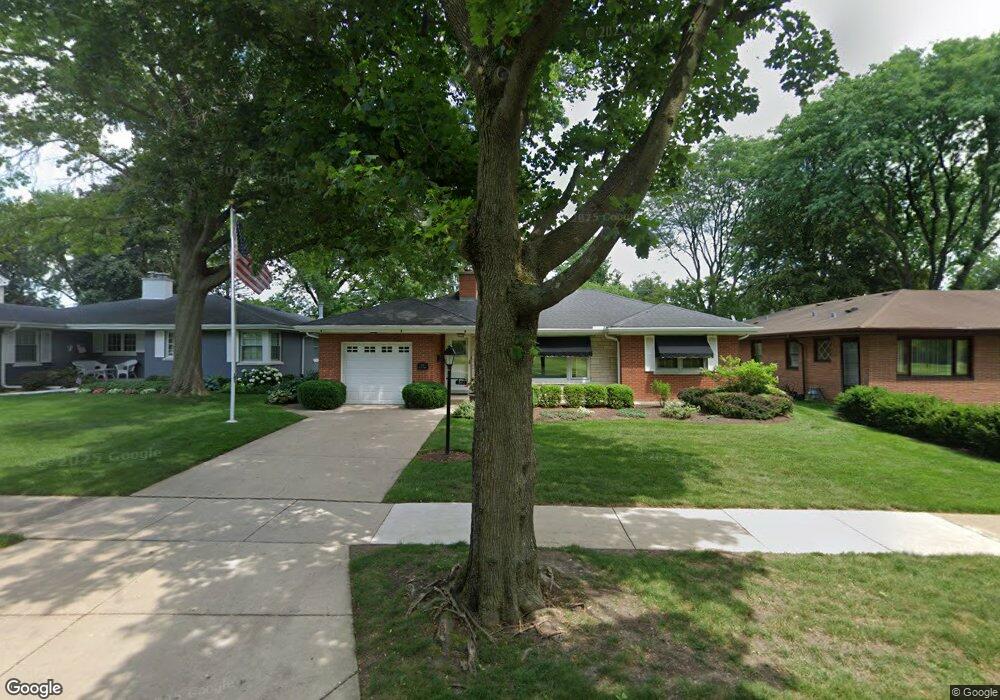
511 S We go Trail Mount Prospect, IL 60056
Estimated Value: $529,335 - $590,000
4
Beds
2
Baths
1,798
Sq Ft
$307/Sq Ft
Est. Value
About This Home
This home is located at 511 S We go Trail, Mount Prospect, IL 60056 and is currently estimated at $551,584, approximately $306 per square foot. 511 S We go Trail is a home located in Cook County with nearby schools including Lions Park Elementary School, Lincoln Middle School, and Prospect High School.
Ownership History
Date
Name
Owned For
Owner Type
Purchase Details
Closed on
Aug 1, 2025
Sold by
Joan A Bratu Trust and Bratu John M
Bought by
John M Bratu Declaration Of Trust and Bratu
Current Estimated Value
Purchase Details
Closed on
Aug 7, 2007
Sold by
Bratu John M and Bratu Joan A
Bought by
Bratu John M and John M Bralu Declaration Of Trust
Purchase Details
Closed on
Apr 17, 2000
Sold by
Trznadel Patricia
Bought by
Bratu John M and Bratu Joan A
Home Financials for this Owner
Home Financials are based on the most recent Mortgage that was taken out on this home.
Original Mortgage
$80,000
Interest Rate
8.22%
Purchase Details
Closed on
Dec 10, 1999
Sold by
Trznadel Patricia A
Bought by
Trznadel Patricia and The Patricia Trznadel Living Trust
Purchase Details
Closed on
May 20, 1998
Sold by
Filak Al M and Filak Katherine
Bought by
Trznadel Patricia A
Home Financials for this Owner
Home Financials are based on the most recent Mortgage that was taken out on this home.
Original Mortgage
$168,000
Interest Rate
7.22%
Create a Home Valuation Report for This Property
The Home Valuation Report is an in-depth analysis detailing your home's value as well as a comparison with similar homes in the area
Home Values in the Area
Average Home Value in this Area
Purchase History
| Date | Buyer | Sale Price | Title Company |
|---|---|---|---|
| John M Bratu Declaration Of Trust | -- | Attorneys Title Guaranty Fund | |
| Bratu John M | -- | None Available | |
| Bratu John M | $279,000 | -- | |
| Trznadel Patricia | -- | -- | |
| Trznadel Patricia A | $210,000 | -- |
Source: Public Records
Mortgage History
| Date | Status | Borrower | Loan Amount |
|---|---|---|---|
| Previous Owner | Bratu John M | $80,000 | |
| Previous Owner | Trznadel Patricia A | $168,000 |
Source: Public Records
Tax History Compared to Growth
Tax History
| Year | Tax Paid | Tax Assessment Tax Assessment Total Assessment is a certain percentage of the fair market value that is determined by local assessors to be the total taxable value of land and additions on the property. | Land | Improvement |
|---|---|---|---|---|
| 2024 | $8,984 | $38,218 | $9,000 | $29,218 |
| 2023 | $9,065 | $40,000 | $9,000 | $31,000 |
| 2022 | $9,065 | $40,000 | $9,000 | $31,000 |
| 2021 | $2,040 | $30,105 | $5,850 | $24,255 |
| 2020 | $7,482 | $30,105 | $5,850 | $24,255 |
| 2019 | $8,013 | $35,391 | $5,850 | $29,541 |
| 2018 | $9,446 | $30,877 | $4,950 | $25,927 |
| 2017 | $2,036 | $31,970 | $4,950 | $27,020 |
| 2016 | $8,493 | $31,970 | $4,950 | $27,020 |
| 2015 | $2,795 | $24,781 | $4,050 | $20,731 |
| 2014 | $6,727 | $27,946 | $4,050 | $23,896 |
| 2013 | $6,691 | $27,946 | $4,050 | $23,896 |
Source: Public Records
Map
Nearby Homes
- 315 S We go Trail
- 522 W Council Trail
- 901 S Can Dota Ave
- 708 S Edgewood Ln
- 437 S Elmhurst Rd
- 909 S We go Trail
- 506 S Busse Rd
- 512 S Busse Rd
- 400 S Wille St
- 613 W Central Rd Unit B7
- 904 S Edgewood Ln
- 1200 W Palm Dr
- 1703 W Robbie Ln
- 701 W Central Rd Unit B3
- 1703 Bonita Ave
- 905 W Palm Dr
- 1720 W Robbie Ln
- 1024 S Hunt Club Dr
- 1326 W Central Rd
- 1105 S Fern Dr
- 513 S We go Trail
- 509 S We go Trail
- 507 S We go Trail
- 510 S See Gwun Ave
- 515 S We go Trail
- 508 S See Gwun Ave
- 512 S See Gwun Ave
- 505 S We go Trail
- 505 S We go Trail
- 506 S See Gwun Ave
- 504 S See Gwun Ave
- 523 S We go Trail
- 502 S See Gwun Ave
- 501 S We go Trail
- 500 S See Gwun Ave
- 500 S We go Trail
- 511 S See Gwun Ave
- 513 S See Gwun Ave
- 509 S See Gwun Ave