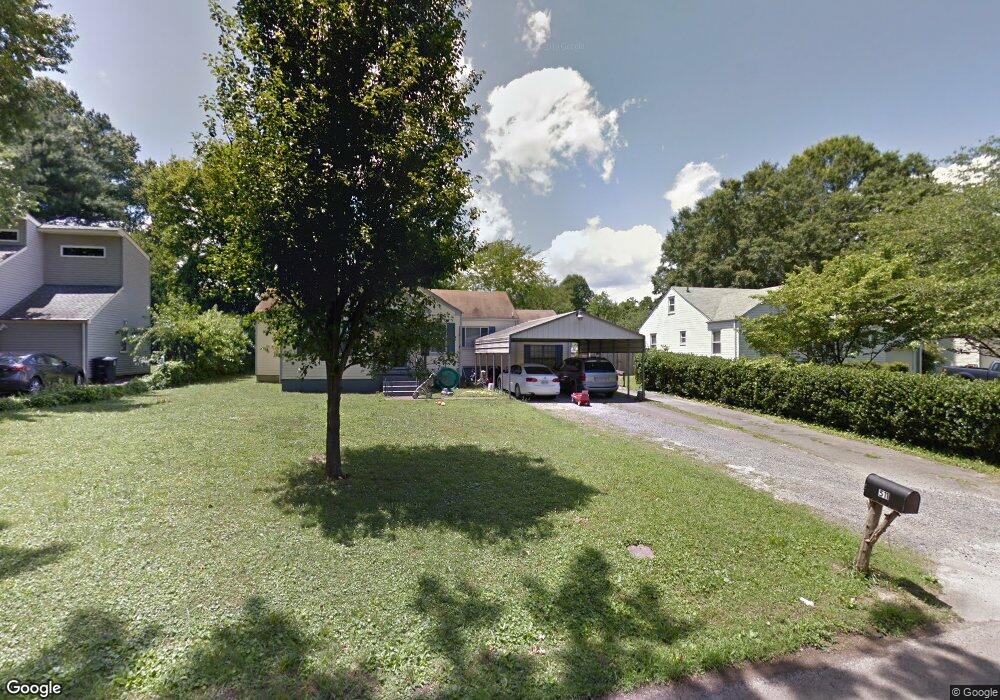
511 Sharondale Rd Unit 1 Chattanooga, TN 37412
Estimated Value: $268,000 - $313,000
--
Bed
2
Baths
1,825
Sq Ft
$162/Sq Ft
Est. Value
About This Home
This home is located at 511 Sharondale Rd Unit 1, Chattanooga, TN 37412 and is currently estimated at $295,316, approximately $161 per square foot. 511 Sharondale Rd Unit 1 is a home located in Hamilton County with nearby schools including East Ridge Elementary School, East Ridge Middle School, and East Ridge High School.
Ownership History
Date
Name
Owned For
Owner Type
Purchase Details
Closed on
Aug 8, 2017
Sold by
Wade Phyllis Houck and Wade Robbie
Bought by
White Shelley M
Current Estimated Value
Purchase Details
Closed on
Jul 7, 2009
Sold by
Household Financial Center Inc
Bought by
Whitt Shelly and Wade Robert L
Home Financials for this Owner
Home Financials are based on the most recent Mortgage that was taken out on this home.
Original Mortgage
$58,950
Interest Rate
5.19%
Mortgage Type
New Conventional
Purchase Details
Closed on
Mar 27, 2009
Sold by
Senn Jimmy and Senn Cheryl Coke
Bought by
Household Financial Center Inc
Purchase Details
Closed on
Oct 23, 1997
Sold by
Coke Senn Cheryl
Bought by
Senn Jimmy
Home Financials for this Owner
Home Financials are based on the most recent Mortgage that was taken out on this home.
Original Mortgage
$49,000
Interest Rate
10.2%
Purchase Details
Closed on
Jun 21, 1995
Sold by
Creed James W
Bought by
Coke Senn Cheryl
Create a Home Valuation Report for This Property
The Home Valuation Report is an in-depth analysis detailing your home's value as well as a comparison with similar homes in the area
Home Values in the Area
Average Home Value in this Area
Purchase History
| Date | Buyer | Sale Price | Title Company |
|---|---|---|---|
| White Shelley M | -- | None Available | |
| Whitt Shelly | $65,500 | Landcastle Title Llc | |
| Household Financial Center Inc | $82,986 | None Available | |
| Senn Jimmy | -- | -- | |
| Coke Senn Cheryl | -- | -- |
Source: Public Records
Mortgage History
| Date | Status | Borrower | Loan Amount |
|---|---|---|---|
| Previous Owner | Whitt Shelly | $58,950 | |
| Previous Owner | Senn Jimmy | $49,000 |
Source: Public Records
Tax History Compared to Growth
Tax History
| Year | Tax Paid | Tax Assessment Tax Assessment Total Assessment is a certain percentage of the fair market value that is determined by local assessors to be the total taxable value of land and additions on the property. | Land | Improvement |
|---|---|---|---|---|
| 2024 | $949 | $42,400 | $0 | $0 |
| 2023 | $1,488 | $42,400 | $0 | $0 |
| 2022 | $1,488 | $42,400 | $0 | $0 |
| 2021 | $1,668 | $42,400 | $0 | $0 |
| 2020 | $1,392 | $29,325 | $0 | $0 |
| 2019 | $1,392 | $29,325 | $0 | $0 |
| 2018 | $1,392 | $29,325 | $0 | $0 |
| 2017 | $1,392 | $29,325 | $0 | $0 |
| 2016 | $1,369 | $0 | $0 | $0 |
| 2015 | $1,369 | $28,175 | $0 | $0 |
| 2014 | $1,369 | $0 | $0 | $0 |
Source: Public Records
Map
Nearby Homes
- 532 Wando Dr
- 514 Marlboro Ave
- 4803 Madonna Ave
- 305 Barbara Cir
- 503 S Lovell Ave
- 616 S Moore Rd
- 207 S Lovell Ave
- 708 Belvoir Ave
- 5207 Weaver St
- 1119 McBrien Rd
- 5004 Kenton Dr
- 703 Belvoir Ave
- 4227 Belvoir Dr
- 1407 Armour St
- 1114 McBrien Rd
- 1311 Boyd St
- 835 Brookfield Ave
- 520 Bacon Trail
- 5390 Reneau Way
- 4214 Belvoir Dr
- 511 Sharondale Rd
- 509 Sharondale Rd
- 513 Sharondale Rd
- 22 Wando Dr
- 559 Wando Dr
- 20 Wando Dr
- 507 Sharondale Rd
- 515 Sharondale Rd
- 24 Wando Dr
- 510 Sharondale Rd
- 26 Wando Dr
- 508 Sharondale Rd
- 512 Sharondale Rd
- 18 Wando Dr
- 517 Sharondale Rd
- 505 Sharondale Rd
- 514 Sharondale Rd
- 506 Sharondale Rd
- 28 Wando Dr
- 21 Wando Dr