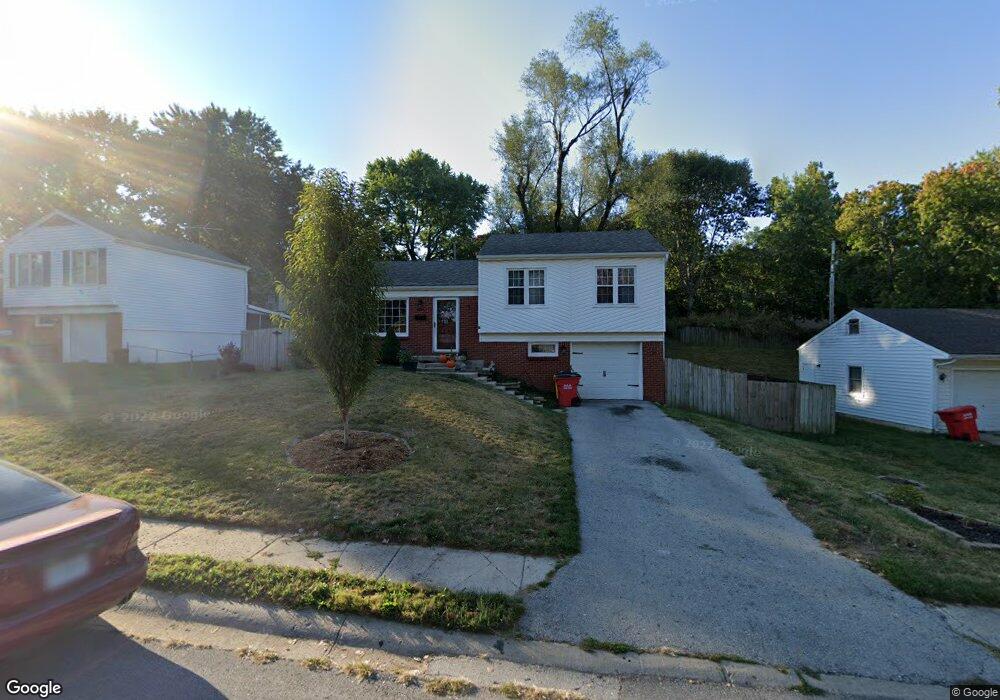
511 W 39th St N Independence, MO 64050
Kentucky Hills NeighborhoodEstimated Value: $176,000 - $200,000
3
Beds
3
Baths
980
Sq Ft
$193/Sq Ft
Est. Value
About This Home
This home is located at 511 W 39th St N, Independence, MO 64050 and is currently estimated at $188,956, approximately $192 per square foot. 511 W 39th St N is a home located in Jackson County with nearby schools including Mill Creek Elementary School, Bridger Middle School, and Bingham Middle School.
Ownership History
Date
Name
Owned For
Owner Type
Purchase Details
Closed on
Jan 3, 2024
Sold by
Thomas Curt and Thomas Peter
Bought by
Sunderman-Thomas Revocable Trust and Sunderman
Current Estimated Value
Purchase Details
Closed on
Nov 5, 2009
Sold by
Coleman Michael D and Coleman Lacy
Bought by
Johnson Mary J
Home Financials for this Owner
Home Financials are based on the most recent Mortgage that was taken out on this home.
Original Mortgage
$88,369
Interest Rate
4.9%
Mortgage Type
FHA
Purchase Details
Closed on
Apr 17, 2007
Sold by
Coleman Michael D and Coleman Lacy
Bought by
Coleman Michael D and Coleman Lacy
Home Financials for this Owner
Home Financials are based on the most recent Mortgage that was taken out on this home.
Original Mortgage
$80,700
Interest Rate
6.1%
Mortgage Type
Stand Alone Refi Refinance Of Original Loan
Create a Home Valuation Report for This Property
The Home Valuation Report is an in-depth analysis detailing your home's value as well as a comparison with similar homes in the area
Home Values in the Area
Average Home Value in this Area
Purchase History
| Date | Buyer | Sale Price | Title Company |
|---|---|---|---|
| Sunderman-Thomas Revocable Trust | -- | None Listed On Document | |
| Johnson Mary J | -- | Chicago | |
| Coleman Michael D | -- | Chicago Title |
Source: Public Records
Mortgage History
| Date | Status | Borrower | Loan Amount |
|---|---|---|---|
| Previous Owner | Johnson Mary J | $88,369 | |
| Previous Owner | Coleman Michael D | $80,700 |
Source: Public Records
Tax History Compared to Growth
Tax History
| Year | Tax Paid | Tax Assessment Tax Assessment Total Assessment is a certain percentage of the fair market value that is determined by local assessors to be the total taxable value of land and additions on the property. | Land | Improvement |
|---|---|---|---|---|
| 2025 | $2,255 | $23,870 | $3,211 | $20,659 |
| 2024 | $2,204 | $32,549 | $2,588 | $29,961 |
| 2023 | $2,204 | $32,549 | $3,363 | $29,186 |
| 2022 | $1,333 | $18,050 | $1,837 | $16,213 |
| 2021 | $1,333 | $18,050 | $1,837 | $16,213 |
| 2020 | $1,302 | $17,127 | $1,837 | $15,290 |
| 2019 | $1,281 | $17,127 | $1,837 | $15,290 |
| 2018 | $1,167 | $14,907 | $1,599 | $13,308 |
| 2017 | $1,167 | $14,907 | $1,599 | $13,308 |
| 2016 | $1,150 | $14,533 | $2,544 | $11,989 |
| 2014 | $1,092 | $14,109 | $2,470 | $11,639 |
Source: Public Records
Map
Nearby Homes
- 602 W 38th St N
- 3801 N Osage St
- 3507 N Pleasant St
- 3509 N Mccoy St
- 3503 N Osage St
- 3101 N Osage St
- 3005 N Union St
- 3015 Cement City Rd
- 709 W 28th St N
- 2120 N Liberty St
- 822 Dickinson Rd
- 0 N Allen Rd
- 1717 N High St
- 11904 Gill St
- 1806 N Cottage St
- 805 N Allen Rd
- 314 N Forest Ave
- 11813 & 11815 E Scarritt Ave
- 1503 N Mccoy St
- 12008 Kentucky Ave
- 509 W 39th St N
- 513 W 39th St N
- 507 W 39th St N
- 601 W 39th St N
- 506 W 38th St N
- 600 W 38th St N
- 510 W 39th St N
- 508 W 39th St N
- 504 W 38th St N
- 506 W 39th St N
- 505 W 39th St N
- 603 W 39th St N
- 512 W 39th St N
- 502 W 38th St N
- 505 W 38th St N
- 504 W 39th St N
- 507 W 38th St N
- 503 W 38th St N
- 503 W 39th St N
- 3903 N Pleasant St