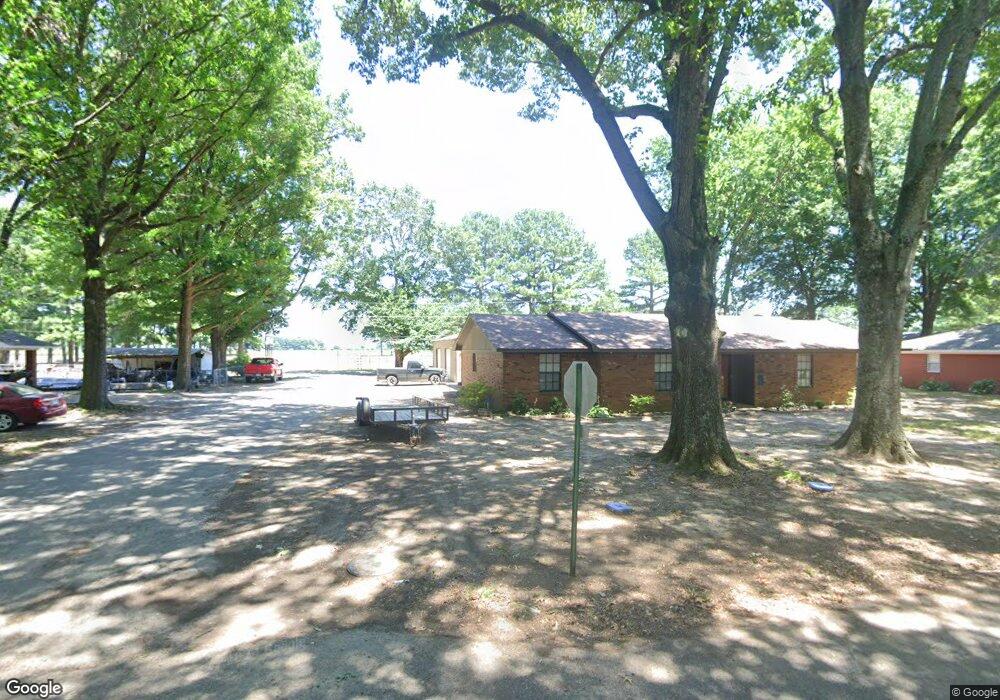
511 Wade St Mc Crory, AR 72101
Estimated Value: $145,000 - $186,000
Studio
2
Baths
1,944
Sq Ft
$85/Sq Ft
Est. Value
About This Home
This home is located at 511 Wade St, Mc Crory, AR 72101 and is currently estimated at $164,541, approximately $84 per square foot. 511 Wade St is a home located in Woodruff County with nearby schools including McCrory Elementary School and McCrory High School.
Ownership History
Date
Name
Owned For
Owner Type
Purchase Details
Closed on
Dec 27, 2017
Sold by
Pitts Patrick D and Pitts Caran M
Bought by
Smith Douglas James and Smith Brandy D
Current Estimated Value
Purchase Details
Closed on
Mar 10, 2010
Sold by
Garner Timothy W
Bought by
Pitts Patrick D
Home Financials for this Owner
Home Financials are based on the most recent Mortgage that was taken out on this home.
Original Mortgage
$95,510
Interest Rate
4.96%
Purchase Details
Closed on
Jul 3, 2008
Sold by
Garner Linda
Bought by
Garner Tim
Purchase Details
Closed on
Jun 1, 2007
Sold by
Barber Singer Patricia
Bought by
Garner Timothy W and Garner
Home Financials for this Owner
Home Financials are based on the most recent Mortgage that was taken out on this home.
Original Mortgage
$95,000
Interest Rate
6.15%
Purchase Details
Closed on
Apr 26, 2001
Bought by
Singer Patricia Barber
Purchase Details
Closed on
Aug 14, 1994
Bought by
Reynolds Derek B
Create a Home Valuation Report for This Property
The Home Valuation Report is an in-depth analysis detailing your home's value as well as a comparison with similar homes in the area
Purchase History
| Date | Buyer | Sale Price | Title Company |
|---|---|---|---|
| Smith Douglas James | $124,000 | Dalco Closing & Title | |
| Pitts Patrick D | $93,500 | -- | |
| Garner Tim | -- | -- | |
| Garner Timothy W | -- | -- | |
| Singer Patricia Barber | $90,000 | -- | |
| Reynolds Derek B | $55,000 | -- |
Source: Public Records
Mortgage History
| Date | Status | Borrower | Loan Amount |
|---|---|---|---|
| Previous Owner | Pitts Patrick D | $95,510 | |
| Previous Owner | Garner Timothy W | $95,000 |
Source: Public Records
Tax History
| Year | Tax Paid | Tax Assessment Tax Assessment Total Assessment is a certain percentage of the fair market value that is determined by local assessors to be the total taxable value of land and additions on the property. | Land | Improvement |
|---|---|---|---|---|
| 2025 | $536 | $38,050 | $2,140 | $35,910 |
| 2024 | $548 | $23,070 | $2,130 | $20,940 |
| 2023 | $603 | $23,070 | $2,130 | $20,940 |
| 2022 | $653 | $23,070 | $2,130 | $20,940 |
| 2021 | $653 | $23,070 | $2,130 | $20,940 |
| 2020 | $653 | $23,070 | $2,130 | $20,940 |
| 2019 | $571 | $18,890 | $1,640 | $17,250 |
| 2018 | $946 | $18,890 | $1,640 | $17,250 |
| 2017 | $579 | $18,890 | $1,640 | $17,250 |
| 2016 | $567 | $18,890 | $1,640 | $17,250 |
| 2015 | $567 | $18,638 | $1,640 | $16,998 |
| 2014 | $523 | $17,750 | $3,250 | $14,500 |
Source: Public Records
Map
Nearby Homes
Your Personal Tour Guide
Ask me questions while you tour the home.