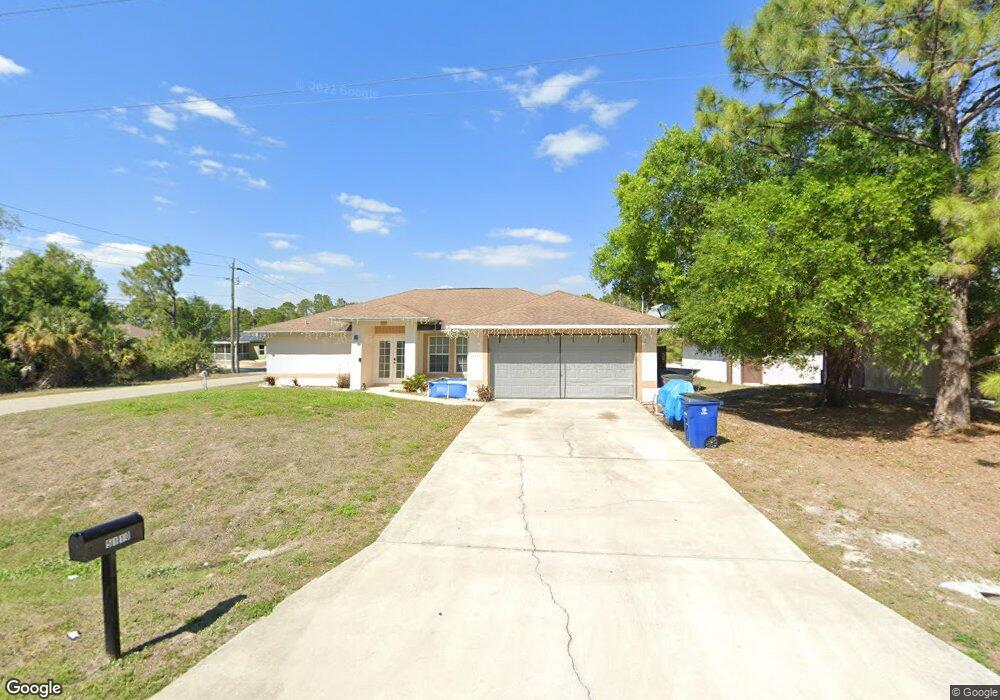
5110 3rd St W Unit 4 Lehigh Acres, FL 33971
Westminster NeighborhoodEstimated Value: $257,296 - $288,000
3
Beds
2
Baths
1,538
Sq Ft
$179/Sq Ft
Est. Value
About This Home
This home is located at 5110 3rd St W Unit 4, Lehigh Acres, FL 33971 and is currently estimated at $274,824, approximately $178 per square foot. 5110 3rd St W Unit 4 is a home located in Lee County with nearby schools including Gateway Elementary School, Lehigh Elementary School, and Tice Elementary School.
Ownership History
Date
Name
Owned For
Owner Type
Purchase Details
Closed on
Jan 29, 2010
Sold by
Pumphrey Trevor John
Bought by
Gorse Properties Llc
Current Estimated Value
Purchase Details
Closed on
Sep 29, 2009
Sold by
Citibank Na
Bought by
Pumphrey Trevor John
Purchase Details
Closed on
Jul 3, 2007
Sold by
Wallace Diane
Bought by
Wallace Diane F and Magnolia Land Trust
Purchase Details
Closed on
Dec 16, 2005
Sold by
Scarbrough John R and Scarbrough Karen J
Bought by
Wallace Diane
Home Financials for this Owner
Home Financials are based on the most recent Mortgage that was taken out on this home.
Original Mortgage
$209,600
Interest Rate
6.23%
Mortgage Type
Construction
Purchase Details
Closed on
Jun 20, 2005
Sold by
Heaton Robert G
Bought by
Scarbrough John R
Create a Home Valuation Report for This Property
The Home Valuation Report is an in-depth analysis detailing your home's value as well as a comparison with similar homes in the area
Home Values in the Area
Average Home Value in this Area
Purchase History
| Date | Buyer | Sale Price | Title Company |
|---|---|---|---|
| Gorse Properties Llc | -- | Commonwealth Land Title Ins | |
| Pumphrey Trevor John | $42,500 | Bay Title & Escrow Company | |
| Wallace Diane F | -- | Attorney | |
| Wallace Diane | $55,000 | Lee Harbor Title Lllp | |
| Scarbrough John R | $34,500 | Executive Title Ins Svcs Inc |
Source: Public Records
Mortgage History
| Date | Status | Borrower | Loan Amount |
|---|---|---|---|
| Previous Owner | Wallace Diane | $209,600 |
Source: Public Records
Tax History Compared to Growth
Tax History
| Year | Tax Paid | Tax Assessment Tax Assessment Total Assessment is a certain percentage of the fair market value that is determined by local assessors to be the total taxable value of land and additions on the property. | Land | Improvement |
|---|---|---|---|---|
| 2025 | $3,297 | $207,998 | -- | -- |
| 2024 | $3,123 | $189,089 | -- | -- |
| 2023 | $3,123 | $171,899 | $0 | $0 |
| 2022 | $2,775 | $156,272 | $0 | $0 |
| 2021 | $2,416 | $152,684 | $7,000 | $145,684 |
| 2020 | $2,315 | $142,930 | $6,700 | $136,230 |
| 2019 | $2,253 | $136,470 | $4,800 | $131,670 |
| 2018 | $2,124 | $125,960 | $4,500 | $121,460 |
| 2017 | $1,983 | $113,849 | $4,500 | $109,349 |
| 2016 | $1,817 | $97,856 | $4,500 | $93,356 |
| 2015 | $1,683 | $86,800 | $3,900 | $82,900 |
| 2014 | -- | $72,902 | $3,060 | $69,842 |
| 2013 | -- | $62,003 | $2,700 | $59,303 |
Source: Public Records
Map
Nearby Homes
- 5014 3rd St W
- 5213 2nd St W Unit 4
- 5110 5th St W
- 4808 Golfview Blvd
- 5200 5th St W
- 5202 6th St W
- 5204 6th St W
- Plan 1540 at Greenbriar - Lehigh Acres
- Plan 2010 at Greenbriar - Lehigh Acres
- Plan 2117 at Greenbriar - Lehigh Acres
- Plan 1755 at Greenbriar - Lehigh Acres
- Plan 1540 at Greenbriar
- Plan 2169 at Greenbriar - Lehigh Acres
- Plan 2169 at Greenbriar
- Plan 2117 at Greenbriar
- Plan 2265 at Greenbriar
- Plan 2010 at Greenbriar
- Plan 2265 at Greenbriar - Lehigh Acres
- Plan 1755 at Greenbriar
- 5031 Locke Ln
- 5108 3rd St W
- 5111 4th St W
- 5109 4th St W
- 5201 4th St W Unit 4
- 5107 4th St W
- 5109 3rd St W Unit 4
- 5104 3rd St W
- 5203 4th St W
- 5107 3rd St W
- 5105 4th St W
- 5105 3rd St W
- 5110 4th St W
- 5102 3rd St W
- 5108 4th St W
- 5108 2nd St W
- 5103 4th St W Unit 4
- 5200 2nd St W
- 5106 4th St W Unit 4
- 5205 4th St W
- 5206 3rd St W