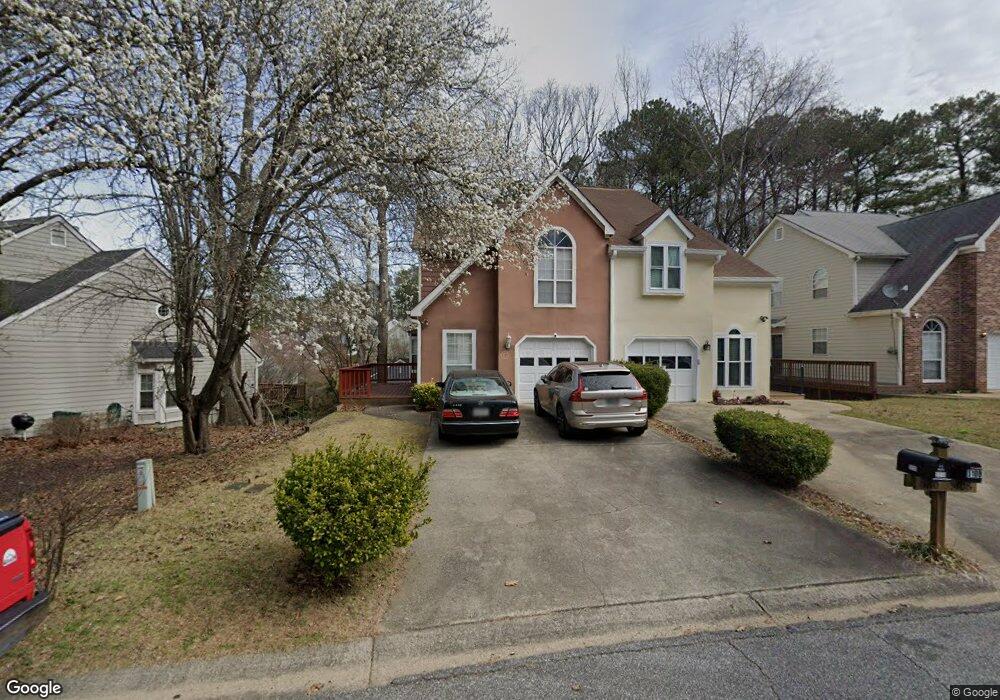
5110 Laurel Bridge Dr SE Smyrna, GA 30082
Estimated Value: $283,570 - $330,000
2
Beds
3
Baths
1,356
Sq Ft
$227/Sq Ft
Est. Value
About This Home
This home is located at 5110 Laurel Bridge Dr SE, Smyrna, GA 30082 and is currently estimated at $307,643, approximately $226 per square foot. 5110 Laurel Bridge Dr SE is a home located in Cobb County with nearby schools including Nickajack Elementary School, Griffin Middle School, and Campbell High School.
Ownership History
Date
Name
Owned For
Owner Type
Purchase Details
Closed on
Jun 30, 2009
Sold by
James Steven
Bought by
Mcglothin Lakeisha F
Current Estimated Value
Home Financials for this Owner
Home Financials are based on the most recent Mortgage that was taken out on this home.
Original Mortgage
$147,283
Outstanding Balance
$93,156
Interest Rate
4.79%
Mortgage Type
FHA
Estimated Equity
$214,487
Purchase Details
Closed on
Apr 10, 2003
Sold by
Sullivan Anderson W
Bought by
James Steven
Home Financials for this Owner
Home Financials are based on the most recent Mortgage that was taken out on this home.
Original Mortgage
$142,550
Interest Rate
5.79%
Mortgage Type
New Conventional
Purchase Details
Closed on
Nov 24, 1998
Sold by
King Harriet S
Bought by
Sullivan Andrew W and Cobb Jan
Home Financials for this Owner
Home Financials are based on the most recent Mortgage that was taken out on this home.
Original Mortgage
$108,750
Interest Rate
6.9%
Mortgage Type
New Conventional
Purchase Details
Closed on
Sep 18, 1996
Sold by
Davis Sharon S
Bought by
King Harriet S
Create a Home Valuation Report for This Property
The Home Valuation Report is an in-depth analysis detailing your home's value as well as a comparison with similar homes in the area
Home Values in the Area
Average Home Value in this Area
Purchase History
| Date | Buyer | Sale Price | Title Company |
|---|---|---|---|
| Mcglothin Lakeisha F | $150,000 | -- | |
| James Steven | $147,000 | -- | |
| Sullivan Andrew W | $114,500 | -- | |
| King Harriet S | $15,000 | -- |
Source: Public Records
Mortgage History
| Date | Status | Borrower | Loan Amount |
|---|---|---|---|
| Open | Mcglothin Lakeisha F | $147,283 | |
| Previous Owner | James Steven | $142,550 | |
| Previous Owner | Sullivan Andrew W | $108,750 | |
| Closed | King Harriet S | $0 |
Source: Public Records
Tax History Compared to Growth
Tax History
| Year | Tax Paid | Tax Assessment Tax Assessment Total Assessment is a certain percentage of the fair market value that is determined by local assessors to be the total taxable value of land and additions on the property. | Land | Improvement |
|---|---|---|---|---|
| 2025 | $4,005 | $147,475 | $24,000 | $123,475 |
| 2024 | $4,129 | $152,036 | $24,000 | $128,036 |
| 2023 | $3,270 | $120,412 | $20,000 | $100,412 |
| 2022 | $2,798 | $102,280 | $20,000 | $82,280 |
| 2021 | $2,812 | $102,280 | $20,000 | $82,280 |
| 2020 | $2,461 | $89,520 | $18,000 | $71,520 |
| 2019 | $2,314 | $84,184 | $18,000 | $66,184 |
| 2018 | $1,952 | $71,012 | $16,000 | $55,012 |
| 2017 | $1,556 | $60,332 | $7,200 | $53,132 |
| 2016 | $1,162 | $45,048 | $8,000 | $37,048 |
| 2015 | $905 | $34,292 | $7,200 | $27,092 |
| 2014 | $914 | $34,292 | $0 | $0 |
Source: Public Records
Map
Nearby Homes
- 5188 Laurel Bridge Ct SE
- 1631 Wehunt Place SE Unit 14
- 5033 David Place SE
- 1529 Slopeside Loop SE
- 308 Holbrook Rd Unit 11
- 4644 Wehunt Commons Dr SE Unit 31
- 109 Wetherbrooke Ln
- 1292 Creekside Terrace SE
- 1286 Creekside Terrace SE
- 4781 Highside Way SE
- 1266 Creekside Terrace SE
- 1222 Creekside Place SE
- 0 Gaylor St Unit 10203409
- 0 Gaylor St Unit 7275195
- 1554 Cooper Lake Rd SE
- 2158 Berryhill Cir SE
- 2163 Berryhill Cir SE
- 4901 Prince Rd SE
- 5108 Laurel Bridge Dr SE Unit n/a
- 5108 Laurel Bridge Dr SE
- 5106 Laurel Bridge Dr SE
- 5112 Laurel Bridge Dr SE
- 5104 Laurel Bridge Dr SE
- 5114 Laurel Bridge Dr SE
- 5118 Laurel Bridge Ct SE Unit 5118
- 5102 Laurel Bridge Dr SE
- 5120 Laurel Bridge Ct SE
- 5100 Laurel Bridge Dr SE
- 5072 Laurel Bridge Dr SE Unit N/a
- 5072 Laurel Bridge Dr SE
- 5070 Laurel Bridge Dr SE Unit 3
- 5068 Laurel Bridge Dr SE
- 5078 Laurel Bridge Dr SE
- 5122 Laurel Bridge Ct SE
- 5066 Laurel Bridge Dr SE
- 5064 Laurel Bridge Dr SE
- 5098 Laurel Bridge Dr SE
- 5204 Laurel Bridge Ct SE