
Seller's Agent in 2025
Cynthia Braun
The Brokerage House
(614) 226-3520
1 in this area
98 Total Sales
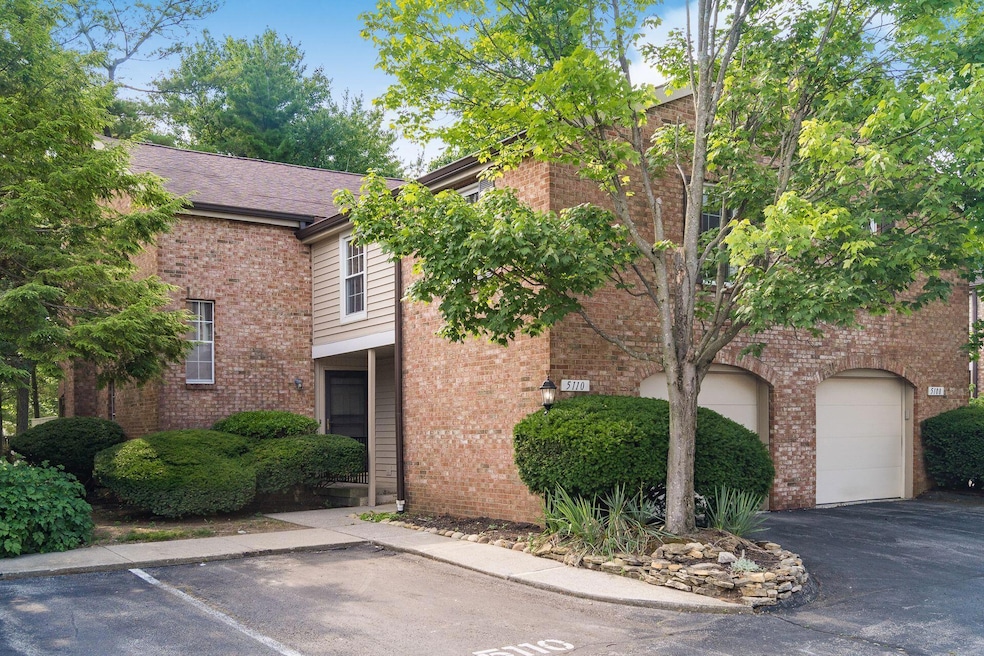
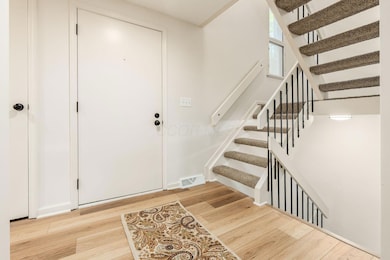
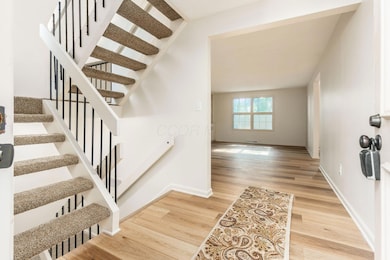
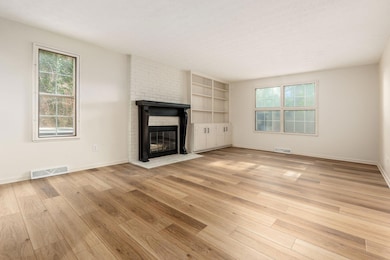
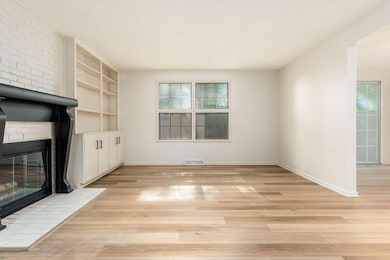
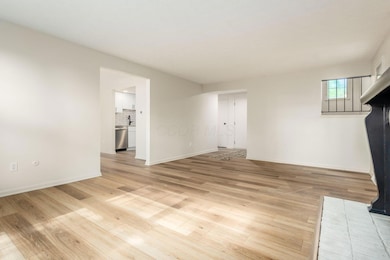
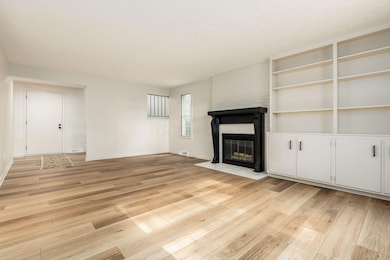
COMPLETELY REMODELED! Largest unit in Rittenhouse Square! All new kitchen, baths, flooring, lighting, paint!
Convenient location near shopping, restaurants, grocery stores and freeway system!
Nothing to do but move in.
3 bedrooms, 2.5 baths, finished basement, oversized 1 car garage, private patio.
Complex has a pool and clubhouse.
Pictures to be entered in the afternoon of 7/11
Last Agent to Sell the Property
The Brokerage House License #2013001795 Listed on: 07/11/2025
| Date | Event | Price | List to Sale | Price per Sq Ft |
|---|---|---|---|---|
| 08/18/2025 08/18/25 | Sold | $285,000 | 0.0% | $173 / Sq Ft |
| 08/11/2025 08/11/25 | Pending | -- | -- | -- |
| 07/11/2025 07/11/25 | For Sale | $285,000 | -- | $173 / Sq Ft |
Seller's Agent in 2025
Cynthia Braun
The Brokerage House
(614) 226-3520
1 in this area
98 Total Sales
Buyer's Agent in 2025
Nicole Yoder-Barnhart
Howard Hanna Real Estate Serv
(614) 679-3412
1 in this area
253 Total Sales
D
Buyer Co-Listing Agent in 2025
Dawn Tietjen
Howard Hanna Real Estate Serv
(614) 753-1846
1 in this area
26 Total Sales
Source: Columbus and Central Ohio Regional MLS
MLS Number: 225025549
APN: 010-091644
Disclaimer: Certain information contained herein is derived from information provided by parties other than Homes.com. All information provided is deemed reliable, but is not guaranteed to be accurate and should be independently verified.
![]() IDX information is provided exclusively for personal, non-commercial use, and may not be used for any purpose other than to identify prospective properties consumers may be interested in purchasing.
IDX information is provided exclusively for personal, non-commercial use, and may not be used for any purpose other than to identify prospective properties consumers may be interested in purchasing.
Information is deemed reliable but not guaranteed.