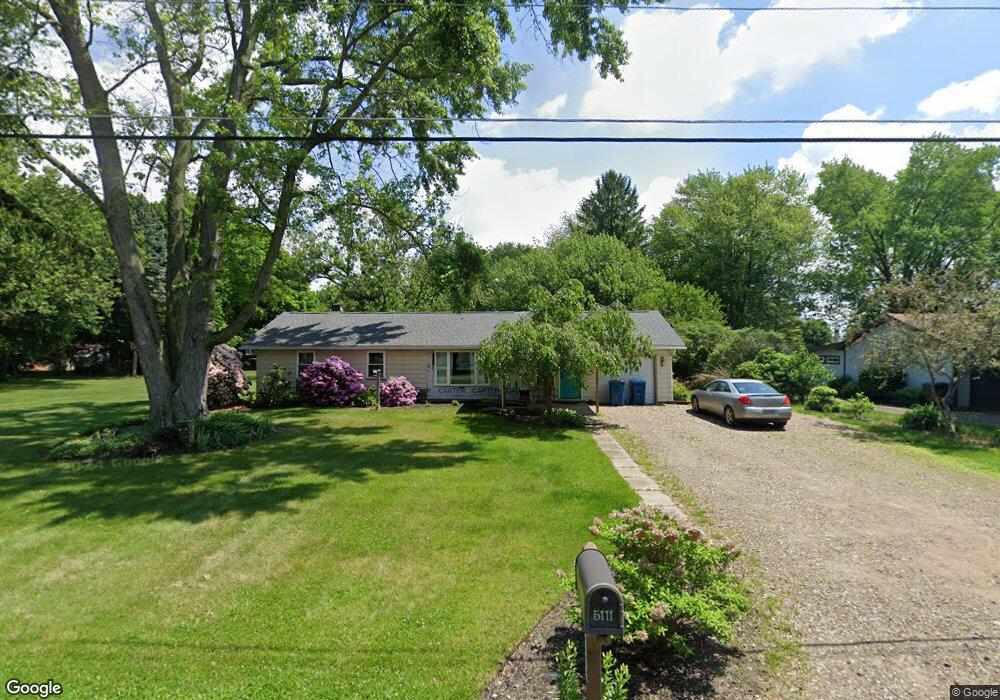
5111 Elno Ave New Franklin, OH 44319
Estimated Value: $177,000 - $255,000
3
Beds
1
Bath
1,520
Sq Ft
$146/Sq Ft
Est. Value
About This Home
This home is located at 5111 Elno Ave, New Franklin, OH 44319 and is currently estimated at $222,376, approximately $146 per square foot. 5111 Elno Ave is a home located in Summit County with nearby schools including Nolley Elementary School, Manchester Middle School, and Manchester High School.
Ownership History
Date
Name
Owned For
Owner Type
Purchase Details
Closed on
Jul 17, 2017
Sold by
Whitmyer James M
Bought by
Doll Jason M and Doll Amy
Current Estimated Value
Home Financials for this Owner
Home Financials are based on the most recent Mortgage that was taken out on this home.
Original Mortgage
$80,000
Outstanding Balance
$66,594
Interest Rate
3.96%
Mortgage Type
New Conventional
Estimated Equity
$155,782
Purchase Details
Closed on
Sep 11, 2006
Sold by
Maxwell Family Llc
Bought by
Whitmyer James M
Home Financials for this Owner
Home Financials are based on the most recent Mortgage that was taken out on this home.
Original Mortgage
$68,000
Interest Rate
6.58%
Mortgage Type
Purchase Money Mortgage
Purchase Details
Closed on
Aug 21, 2004
Sold by
Maxwell Irene M and Cordray Veronica R
Bought by
Maxwell Family Llc
Purchase Details
Closed on
Feb 12, 2002
Sold by
Maxwell Irene M
Bought by
Maxwell Kenneth
Create a Home Valuation Report for This Property
The Home Valuation Report is an in-depth analysis detailing your home's value as well as a comparison with similar homes in the area
Home Values in the Area
Average Home Value in this Area
Purchase History
| Date | Buyer | Sale Price | Title Company |
|---|---|---|---|
| Doll Jason M | $100,000 | None Available | |
| Whitmyer James M | $85,000 | Land America-Lawyers Title | |
| Maxwell Family Llc | -- | None Available | |
| Maxwell Kenneth | -- | -- |
Source: Public Records
Mortgage History
| Date | Status | Borrower | Loan Amount |
|---|---|---|---|
| Open | Doll Jason M | $80,000 | |
| Previous Owner | Whitmyer James M | $68,000 |
Source: Public Records
Tax History Compared to Growth
Tax History
| Year | Tax Paid | Tax Assessment Tax Assessment Total Assessment is a certain percentage of the fair market value that is determined by local assessors to be the total taxable value of land and additions on the property. | Land | Improvement |
|---|---|---|---|---|
| 2025 | $3,262 | $65,356 | $15,939 | $49,417 |
| 2024 | $3,262 | $65,356 | $15,939 | $49,417 |
| 2023 | $3,262 | $65,356 | $15,939 | $49,417 |
| 2022 | $3,077 | $47,432 | $11,550 | $35,882 |
| 2021 | $3,050 | $47,432 | $11,550 | $35,882 |
| 2020 | $3,035 | $47,430 | $11,550 | $35,880 |
| 2019 | $2,749 | $38,970 | $11,550 | $27,420 |
| 2018 | $2,371 | $38,970 | $11,550 | $27,420 |
| 2017 | $2,598 | $38,970 | $11,550 | $27,420 |
| 2016 | $2,568 | $37,000 | $11,550 | $25,450 |
| 2015 | $2,598 | $37,000 | $11,550 | $25,450 |
| 2014 | $2,579 | $37,000 | $11,550 | $25,450 |
| 2013 | $2,566 | $37,030 | $11,550 | $25,480 |
Source: Public Records
Map
Nearby Homes
- S/L 14,15 Shakes Hotel Dr
- 6 Shrakes Hotel Dr
- 4 Shrakes Hotel Dr
- 7 Shrakes Hotel Dr
- 5 Shrakes Hotel Dr
- 3 Shrakes Hotel Dr
- 4881 S Main St
- 427 Center Rd
- 4944 Coleman Dr
- 4869 Coleman Dr
- 4751 Bickford Ave
- 4831 Christman Rd
- lot 8 Whyem Dr
- 4682 Bali Dr
- 4943 Provens Dr
- 715 Highland Park Dr
- 5737 Towerview Dr
- 809 Zeletta Dr
- 683 Chilham Cir
- 4298 S Main St Unit 4302