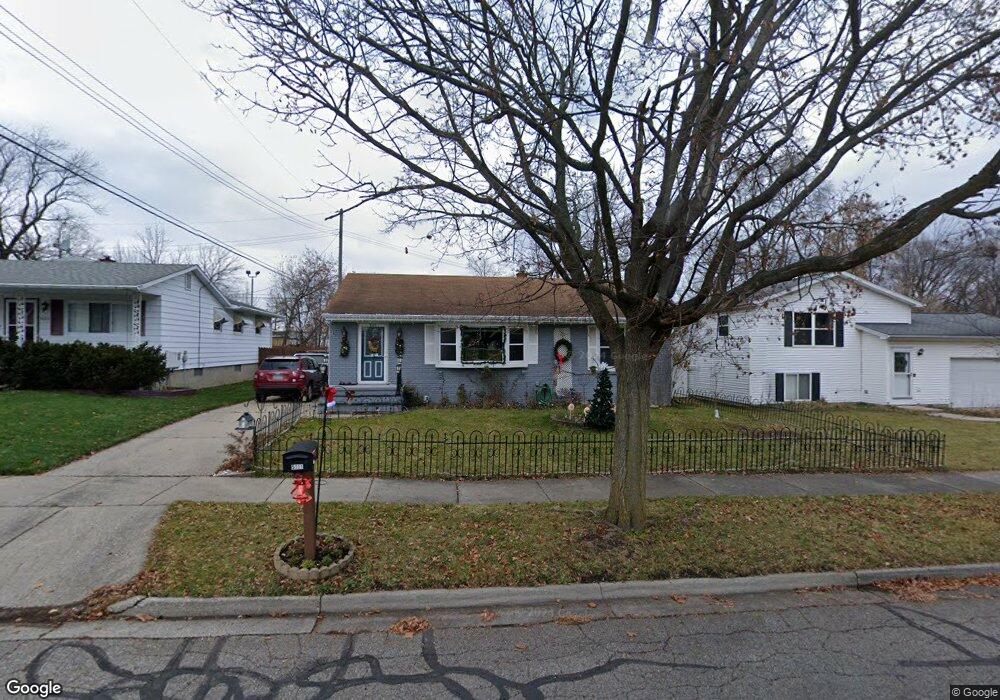
5111 Tulip Ave Lansing, MI 48911
Southern Lansing NeighborhoodEstimated Value: $155,891 - $207,000
--
Bed
1
Bath
1,133
Sq Ft
$162/Sq Ft
Est. Value
About This Home
This home is located at 5111 Tulip Ave, Lansing, MI 48911 and is currently estimated at $183,723, approximately $162 per square foot. 5111 Tulip Ave is a home located in Ingham County with nearby schools including Kendon School, Attwood School, and Everett High School.
Ownership History
Date
Name
Owned For
Owner Type
Purchase Details
Closed on
Dec 6, 2019
Sold by
Sutherland Steven P and Sutherland Patricia L
Bought by
Sutherland Patricia L
Current Estimated Value
Create a Home Valuation Report for This Property
The Home Valuation Report is an in-depth analysis detailing your home's value as well as a comparison with similar homes in the area
Home Values in the Area
Average Home Value in this Area
Purchase History
| Date | Buyer | Sale Price | Title Company |
|---|---|---|---|
| Sutherland Patricia L | -- | None Available |
Source: Public Records
Tax History Compared to Growth
Tax History
| Year | Tax Paid | Tax Assessment Tax Assessment Total Assessment is a certain percentage of the fair market value that is determined by local assessors to be the total taxable value of land and additions on the property. | Land | Improvement |
|---|---|---|---|---|
| 2025 | $2,652 | $82,200 | $11,300 | $70,900 |
| 2024 | $21 | $68,200 | $11,300 | $56,900 |
| 2023 | $2,487 | $61,400 | $11,300 | $50,100 |
| 2022 | $2,243 | $53,900 | $9,800 | $44,100 |
| 2021 | $2,727 | $49,500 | $7,500 | $42,000 |
| 2020 | $3,632 | $45,400 | $7,500 | $37,900 |
| 2019 | $2,092 | $41,100 | $7,500 | $33,600 |
| 2018 | $1,961 | $38,900 | $7,500 | $31,400 |
| 2017 | $1,877 | $38,900 | $7,500 | $31,400 |
| 2016 | $1,823 | $33,900 | $7,500 | $26,400 |
| 2015 | $1,823 | $32,100 | $15,000 | $17,100 |
| 2014 | $1,823 | $32,100 | $21,600 | $10,500 |
Source: Public Records
Map
Nearby Homes
- 5006 Delbrook Ave
- 5026 Delray Dr Unit A
- 4935 Delray Dr
- 833 Dornell Ave
- 0 W Jolly Rd
- 4800 Ora St
- 1014 W Northrup St
- 5011 Stafford Ave
- 129 Village Dr
- 4407 Burchfield Ave
- 1324 N Briarfield Dr
- 5636 Ellendale Dr
- 4414 S Martin Luther King jr Blvd
- 4916 Tressa Dr
- 600 W Cavanaugh Rd
- 201 E Syringa Dr
- 105 Cox Blvd
- 4125 Lowcroft Ave
- 1415 Reo Rd
- 4114 Burchfield Dr