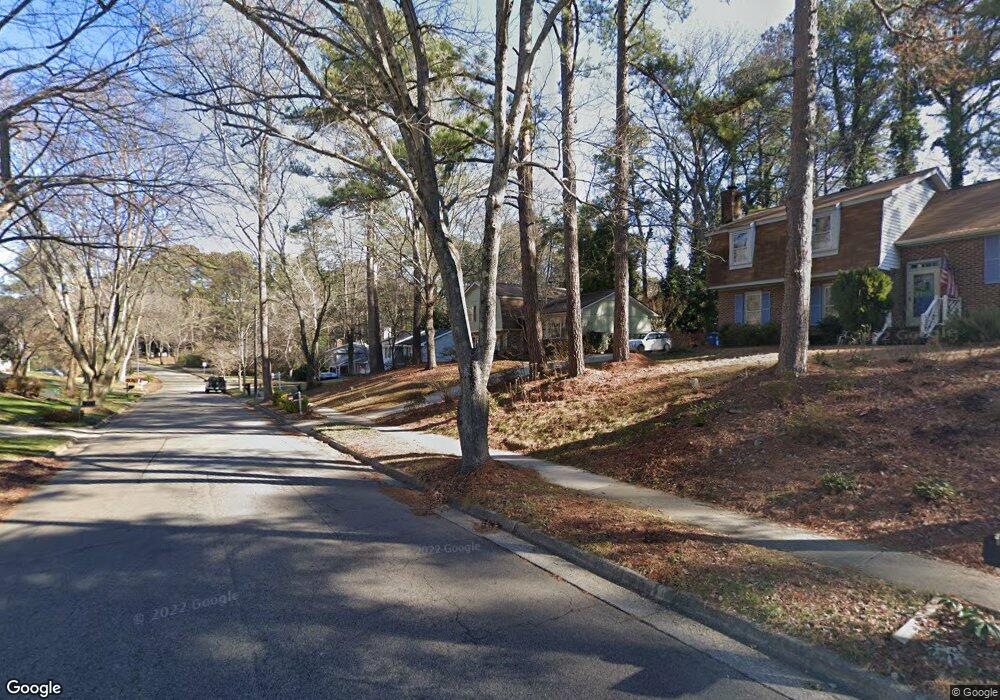
5112 Cedarwood Dr Raleigh, NC 27609
North Hills NeighborhoodEstimated Value: $472,000 - $615,000
3
Beds
3
Baths
1,950
Sq Ft
$282/Sq Ft
Est. Value
About This Home
This home is located at 5112 Cedarwood Dr, Raleigh, NC 27609 and is currently estimated at $549,112, approximately $281 per square foot. 5112 Cedarwood Dr is a home located in Wake County with nearby schools including Green Elementary, Carroll Middle, and Sanderson High School.
Ownership History
Date
Name
Owned For
Owner Type
Purchase Details
Closed on
Dec 31, 2009
Sold by
Potter Corrie Lynn
Bought by
Baez Ignacio and Baez Eva Sofia
Current Estimated Value
Home Financials for this Owner
Home Financials are based on the most recent Mortgage that was taken out on this home.
Original Mortgage
$189,504
Outstanding Balance
$123,597
Interest Rate
4.82%
Mortgage Type
FHA
Estimated Equity
$425,515
Purchase Details
Closed on
May 30, 2002
Sold by
Hults Patricia Ann
Bought by
Porter Carrie Lynn
Home Financials for this Owner
Home Financials are based on the most recent Mortgage that was taken out on this home.
Original Mortgage
$152,950
Interest Rate
7%
Purchase Details
Closed on
Jul 1, 1998
Sold by
Morris Stephen R
Bought by
Hults Patricia Ann
Home Financials for this Owner
Home Financials are based on the most recent Mortgage that was taken out on this home.
Original Mortgage
$100,000
Interest Rate
7.1%
Create a Home Valuation Report for This Property
The Home Valuation Report is an in-depth analysis detailing your home's value as well as a comparison with similar homes in the area
Home Values in the Area
Average Home Value in this Area
Purchase History
| Date | Buyer | Sale Price | Title Company |
|---|---|---|---|
| Baez Ignacio | $193,000 | None Available | |
| Porter Carrie Lynn | $161,000 | -- | |
| Hults Patricia Ann | $135,000 | Fidelity National Title Ins |
Source: Public Records
Mortgage History
| Date | Status | Borrower | Loan Amount |
|---|---|---|---|
| Open | Baez Ignacio | $189,504 | |
| Previous Owner | Porter Carrie Lynn | $152,950 | |
| Previous Owner | Hults Patricia Ann | $100,000 |
Source: Public Records
Tax History Compared to Growth
Tax History
| Year | Tax Paid | Tax Assessment Tax Assessment Total Assessment is a certain percentage of the fair market value that is determined by local assessors to be the total taxable value of land and additions on the property. | Land | Improvement |
|---|---|---|---|---|
| 2025 | $3,867 | $441,148 | $400,000 | $41,148 |
| 2024 | $3,851 | $441,148 | $400,000 | $41,148 |
| 2023 | $2,847 | $259,344 | $150,000 | $109,344 |
| 2022 | $2,646 | $259,344 | $150,000 | $109,344 |
| 2021 | $2,543 | $259,344 | $150,000 | $109,344 |
| 2020 | $2,497 | $259,344 | $150,000 | $109,344 |
| 2019 | $2,468 | $211,269 | $100,000 | $111,269 |
| 2018 | $2,328 | $211,269 | $100,000 | $111,269 |
| 2017 | $2,218 | $211,269 | $100,000 | $111,269 |
| 2016 | $2,172 | $211,269 | $100,000 | $111,269 |
| 2015 | $1,964 | $187,706 | $75,000 | $112,706 |
| 2014 | $1,863 | $187,706 | $75,000 | $112,706 |
Source: Public Records
Map
Nearby Homes
- 5104 Cedarwood Dr
- 5080 Flint Ridge Place Unit 5080
- 508 Driewood Ct
- 5026 Flint Ridge Place
- 642 Pine Ridge Place Unit 642
- 5073 Tall Pines Ct Unit 5073
- 5082 Flint Ridge Place Unit 5082
- 717 E Millbrook Rd Unit 717
- 635 Pine Ridge Place
- 612 Pine Ridge Place
- 677 Pine Ridge Place
- 627 Pine Ridge Place
- 5036 Flint Ridge Place Unit 5036
- 514 Pine Ridge Place
- 667 Pine Ridge Place
- 601 Duke Dr
- 4921 Sweetbriar Dr
- 5309 Alpine Dr
- 4900 Great Meadows Ct
- 4901 Baylor Ct
- 5116 Cedarwood Dr
- 5108 Cedarwood Dr
- 5200 Cedarwood Dr
- 5109 Cedarwood Dr
- 5105 Cedarwood Dr
- 5113 Cedarwood Dr
- 5100 Cedarwood Dr
- 5201 Cedarwood Dr
- 5101 Cedarwood Dr
- 5130 Flint Ridge Place Unit 5130
- 508 Cedar Hill Ln
- 5102 Flint Ridge Place Unit 5102
- 5102 Flint Ridge Place
- 5102 Flint Ridge Place
- 5205 Cedarwood Dr
- 5008 Cedarwood Dr
- 504 Cedar Hill Ln
- 501 Driewood Ct
- 505 Cedar Hill Ln
- 5209 Cedarwood Dr