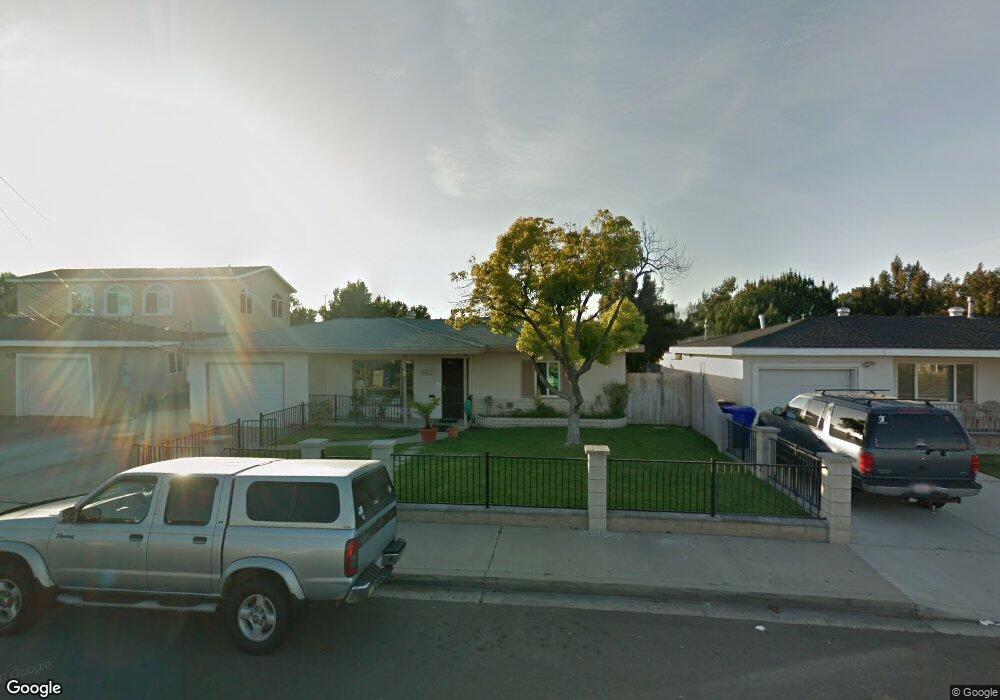
5112 E Falls View Dr San Diego, CA 92115
College East NeighborhoodEstimated Value: $1,296,000 - $2,125,000
4
Beds
2
Baths
1,540
Sq Ft
$1,123/Sq Ft
Est. Value
About This Home
This home is located at 5112 E Falls View Dr, San Diego, CA 92115 and is currently estimated at $1,729,590, approximately $1,123 per square foot. 5112 E Falls View Dr is a home located in San Diego County with nearby schools including Hardy Elementary School, Clay Elementary School, and Lewis Middle School.
Ownership History
Date
Name
Owned For
Owner Type
Purchase Details
Closed on
Jul 2, 2025
Sold by
Eagles Nest Properties Llc
Bought by
Eagles Nest Properties Llc
Current Estimated Value
Purchase Details
Closed on
Apr 21, 2025
Sold by
Eagle Nest Properties Llc
Bought by
Pacific Residential Llc
Purchase Details
Closed on
Jul 21, 2021
Sold by
Eagles Nest Properties Llc
Bought by
Todd Phillip A and Todd Diana J
Home Financials for this Owner
Home Financials are based on the most recent Mortgage that was taken out on this home.
Original Mortgage
$753,250
Interest Rate
2.93%
Mortgage Type
New Conventional
Purchase Details
Closed on
Jul 13, 2019
Sold by
Todd Phillip A and Todd Diana J
Bought by
Eagles Nest Properties Llc
Purchase Details
Closed on
Sep 25, 2018
Sold by
Todd Diana J Wilson and Todd Phillip A
Bought by
Eagles Nest Properties Llc
Purchase Details
Closed on
Jul 24, 2018
Sold by
The Church In San Diego
Bought by
Wilson Diana J and Todd Phillip A
Create a Home Valuation Report for This Property
The Home Valuation Report is an in-depth analysis detailing your home's value as well as a comparison with similar homes in the area
Home Values in the Area
Average Home Value in this Area
Purchase History
| Date | Buyer | Sale Price | Title Company |
|---|---|---|---|
| Eagles Nest Properties Llc | -- | First American Title | |
| Pacific Residential Llc | $1,100,000 | None Listed On Document | |
| Todd Phillip A | -- | Lawyers Title Company | |
| Eagles Nest Properties Llc | -- | Accommodation | |
| Todd Phillip A | -- | None Available | |
| Eagles Nest Properties Llc | -- | None Available | |
| Wilson Diana J | $625,000 | Chicago Title Company Sd |
Source: Public Records
Mortgage History
| Date | Status | Borrower | Loan Amount |
|---|---|---|---|
| Previous Owner | Todd Phillip A | $753,250 |
Source: Public Records
Tax History Compared to Growth
Tax History
| Year | Tax Paid | Tax Assessment Tax Assessment Total Assessment is a certain percentage of the fair market value that is determined by local assessors to be the total taxable value of land and additions on the property. | Land | Improvement |
|---|---|---|---|---|
| 2025 | $10,547 | $872,177 | $529,869 | $342,308 |
| 2024 | $10,547 | $855,077 | $519,480 | $335,597 |
| 2023 | $10,304 | $838,312 | $509,295 | $329,017 |
| 2022 | $10,030 | $821,875 | $499,309 | $322,566 |
| 2021 | $9,961 | $805,761 | $489,519 | $316,242 |
| 2020 | $9,841 | $797,500 | $484,500 | $313,000 |
| 2019 | $7,733 | $625,000 | $475,000 | $150,000 |
| 2018 | $1,669 | $139,303 | $59,697 | $79,606 |
| 2017 | $1,629 | $136,573 | $58,527 | $78,046 |
| 2016 | $1,602 | $133,896 | $57,380 | $76,516 |
| 2015 | $1,579 | $131,886 | $56,519 | $75,367 |
| 2014 | $1,555 | $129,303 | $55,412 | $73,891 |
Source: Public Records
Map
Nearby Homes
- 4917 Rockford Dr
- 6411 Gary Ct
- 4926 Cresita Dr
- 6486 Montezuma Rd
- 5092 Catoctin Dr
- 4749 Choctaw Dr
- 5157 Catoctin Dr
- 6457 Julie St
- 4727 Choctaw Dr
- 4860 Rolando Ct Unit 52
- 4860 Rolando Ct Unit 25
- 4860 Rolando Ct Unit 42
- 4860 Rolando Ct Unit 29
- 4860 Rolando Ct Unit 81
- 6496 Cleo St
- 4866 Barbarossa Place
- 4733 Soria Dr
- 6615 Reservoir Ct
- 5540 Lindo Paseo Unit 19
- 4777 Seminole Dr Unit 118
- 5118 E Falls View Dr
- 5108 E Falls View Dr
- 5122 E Falls View Dr
- 5111 E Falls View Dr
- 5104 E Falls View Dr
- 5117 E Falls View Dr
- 5103 E Falls View Dr
- 5130 E Falls View Dr
- 6246 Montezuma Rd
- 5123 E Falls View Dr
- 6253 Adobe Dr
- 6258 Montezuma Rd
- 6249 Adobe Dr
- 5136 E Falls View Dr
- 5127 E Falls View Dr
- 5104 63rd St
- 6245 Adobe Dr
- 5114 63rd St
- 5131 E Falls View Dr
- 5120/5122 63rd St