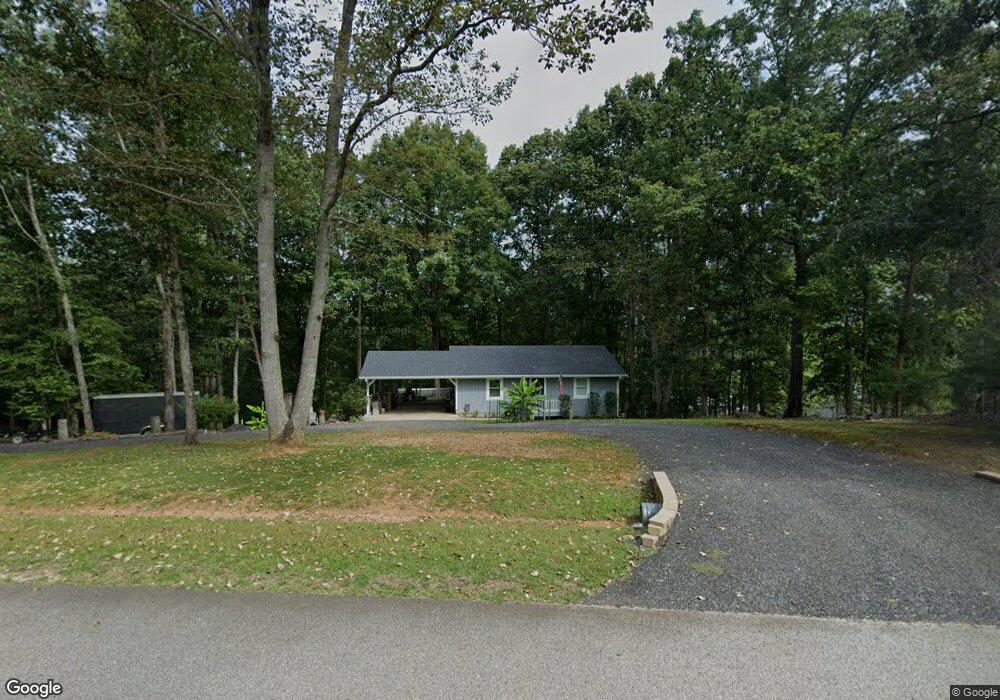
5112 La Place Gainesville, GA 30506
Estimated Value: $214,495 - $311,000
1
Bed
1
Bath
840
Sq Ft
$319/Sq Ft
Est. Value
About This Home
This home is located at 5112 La Place, Gainesville, GA 30506 and is currently estimated at $267,874, approximately $318 per square foot. 5112 La Place is a home located in Hall County with nearby schools including Elbert Elementary School, Mount Vernon Elementary School, and North Hall Middle School.
Ownership History
Date
Name
Owned For
Owner Type
Purchase Details
Closed on
Jun 23, 2005
Sold by
Hud
Bought by
Carter Drew
Current Estimated Value
Home Financials for this Owner
Home Financials are based on the most recent Mortgage that was taken out on this home.
Original Mortgage
$54,000
Outstanding Balance
$28,409
Interest Rate
5.88%
Mortgage Type
New Conventional
Estimated Equity
$239,465
Purchase Details
Closed on
Nov 2, 2004
Sold by
Rbmg Inc
Bought by
Hud
Purchase Details
Closed on
Sep 30, 1999
Sold by
Lane Michael
Bought by
Lane Michael and Lane Jennifer L
Home Financials for this Owner
Home Financials are based on the most recent Mortgage that was taken out on this home.
Original Mortgage
$66,600
Interest Rate
7.79%
Mortgage Type
FHA
Purchase Details
Closed on
Feb 20, 1998
Sold by
Shope J B
Bought by
Wilbanks Eric B
Home Financials for this Owner
Home Financials are based on the most recent Mortgage that was taken out on this home.
Original Mortgage
$51,300
Interest Rate
7.07%
Mortgage Type
New Conventional
Create a Home Valuation Report for This Property
The Home Valuation Report is an in-depth analysis detailing your home's value as well as a comparison with similar homes in the area
Home Values in the Area
Average Home Value in this Area
Purchase History
| Date | Buyer | Sale Price | Title Company |
|---|---|---|---|
| Carter Drew | -- | -- | |
| Hud | -- | -- | |
| Rbmg Inc | $71,572 | -- | |
| Rbmg Inc | $71,600 | -- | |
| Lane Michael | -- | -- | |
| Lane Michael | $67,600 | -- | |
| Wilbanks Eric B | $57,000 | -- |
Source: Public Records
Mortgage History
| Date | Status | Borrower | Loan Amount |
|---|---|---|---|
| Open | Carter Drew | $54,000 | |
| Previous Owner | Lane Michael | $66,600 | |
| Previous Owner | Wilbanks Eric B | $51,300 |
Source: Public Records
Tax History Compared to Growth
Tax History
| Year | Tax Paid | Tax Assessment Tax Assessment Total Assessment is a certain percentage of the fair market value that is determined by local assessors to be the total taxable value of land and additions on the property. | Land | Improvement |
|---|---|---|---|---|
| 2024 | $1,389 | $55,168 | $12,160 | $43,008 |
| 2023 | $1,509 | $57,688 | $12,160 | $45,528 |
| 2022 | $1,279 | $47,048 | $11,360 | $35,688 |
| 2021 | $935 | $34,788 | $6,320 | $28,468 |
| 2020 | $920 | $33,308 | $6,320 | $26,988 |
| 2019 | $885 | $31,720 | $6,320 | $25,400 |
| 2018 | $793 | $27,520 | $6,320 | $21,200 |
| 2017 | $729 | $25,480 | $6,320 | $19,160 |
| 2016 | $739 | $26,447 | $6,160 | $20,287 |
| 2015 | $745 | $26,447 | $6,160 | $20,287 |
| 2014 | $745 | $26,447 | $6,160 | $20,287 |
Source: Public Records
Map
Nearby Homes
- 5234 Laurel Ln
- 5231 Laurel Cir
- 5264 Laurel Cir
- 5281 Laurel Ln
- 3849 Mark Trail
- 3847 Erwin Dr
- 0 Lawson Cir Unit 10403965
- 4632 Shirley Rd Unit LOT 3
- 4632 Shirley Rd
- 4620 Shirley Rd
- 4638 Shirley Rd
- 4644 Shirley Rd Unit LOT 1
- 4540 Shirley Rd Unit LOT 15
- 4620 Shirley Rd Unit LOT 5
- 4540 Shirley Rd
- 4644 Shirley Rd
- 4638 Shirley Rd Unit LOT 2
- 4548 Shirley Rd
- 4548 Shirley Rd Unit LOT 14
- 4564 Shirley Rd
- 5207 Janice Cir
- 5106 Laurel Ln
- 5133 Laurel Ln
- 5211 Janice Cir
- 5216 Janice Cir
- 5121 Laurel Ln
- 5208 Janice Cir
- 5122 Laurel Ln
- 0 Janice Cir Unit 8271439
- 0 Janice Cir Unit 8329010
- 5204 Laurel Ln
- 5103 Laurel Ln
- 5210 Laurel Ln
- 5085 Highland Rd
- 5214 Forest Cove Rd
- 5209 Laurel Cir
- 5209 Laurel Cir
- 5216 Laurel Ln
- 5216 Laurel Ln Unit 3
- 5116 Laurel Ln