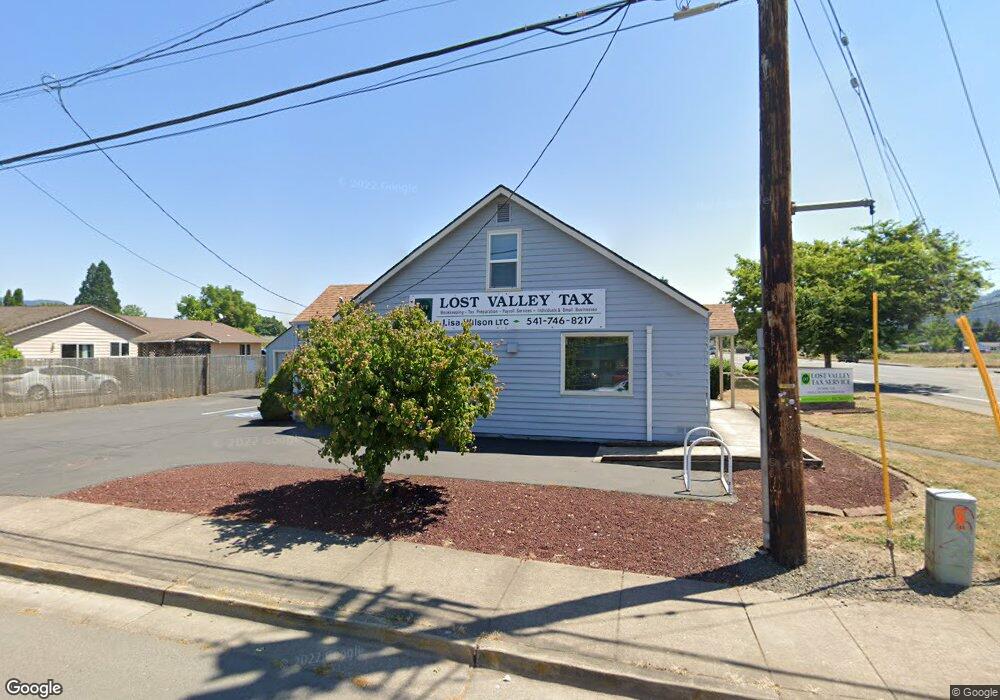
5112 Main St Springfield, OR 97478
East Springfield NeighborhoodEstimated Value: $353,000 - $447,000
3
Beds
2
Baths
1,300
Sq Ft
$300/Sq Ft
Est. Value
About This Home
This home is located at 5112 Main St, Springfield, OR 97478 and is currently estimated at $389,697, approximately $299 per square foot. 5112 Main St is a home located in Lane County with nearby schools including Riverbend Elementary School, Agnes Stewart Middle School, and Thurston High School.
Ownership History
Date
Name
Owned For
Owner Type
Purchase Details
Closed on
Oct 8, 2015
Sold by
White Steven L and Todd Maish G
Bought by
Maish White Investments Llc
Current Estimated Value
Purchase Details
Closed on
Feb 5, 2007
Sold by
Trefethen Sanford and Webb John
Bought by
White Steven L and Todd Maish G
Home Financials for this Owner
Home Financials are based on the most recent Mortgage that was taken out on this home.
Original Mortgage
$220,000
Outstanding Balance
$130,656
Interest Rate
6.19%
Mortgage Type
Commercial
Estimated Equity
$259,041
Purchase Details
Closed on
Nov 14, 2001
Sold by
Steinke Ralph M and Steinke Ruth Ann
Bought by
Trefethen Sanford L and Webb John M
Home Financials for this Owner
Home Financials are based on the most recent Mortgage that was taken out on this home.
Original Mortgage
$110,700
Interest Rate
8.62%
Mortgage Type
Commercial
Create a Home Valuation Report for This Property
The Home Valuation Report is an in-depth analysis detailing your home's value as well as a comparison with similar homes in the area
Home Values in the Area
Average Home Value in this Area
Purchase History
| Date | Buyer | Sale Price | Title Company |
|---|---|---|---|
| Maish White Investments Llc | -- | None Available | |
| White Steven L | $275,000 | Evergreen Land Title Company | |
| Trefethen Sanford L | $123,000 | Cascade Title Co |
Source: Public Records
Mortgage History
| Date | Status | Borrower | Loan Amount |
|---|---|---|---|
| Open | White Steven L | $220,000 | |
| Previous Owner | Trefethen Sanford L | $110,700 |
Source: Public Records
Tax History
| Year | Tax Paid | Tax Assessment Tax Assessment Total Assessment is a certain percentage of the fair market value that is determined by local assessors to be the total taxable value of land and additions on the property. | Land | Improvement |
|---|---|---|---|---|
| 2025 | $3,168 | $172,750 | -- | -- |
| 2024 | $3,117 | $167,719 | -- | -- |
| 2023 | $3,117 | $162,834 | $0 | $0 |
| 2022 | $2,886 | $158,092 | $0 | $0 |
| 2021 | $2,835 | $153,488 | $0 | $0 |
| 2020 | $2,752 | $149,018 | $0 | $0 |
| 2019 | $2,669 | $144,678 | $0 | $0 |
| 2018 | $2,516 | $136,374 | $0 | $0 |
| 2017 | $2,419 | $136,374 | $0 | $0 |
| 2016 | $2,369 | $132,402 | $0 | $0 |
| 2015 | $2,301 | $128,546 | $0 | $0 |
| 2014 | $2,266 | $124,802 | $0 | $0 |
Source: Public Records
Map
Nearby Homes
- 0 N St
- 422 S 49th Place
- 5495 A Units 69 70 71 72 St
- 708 51st St
- 5254 Forsythia St
- 5335 Main St Unit 236
- 5335 Main St
- 5335 Main St Unit 184
- 5335 Main St Unit 197
- 5335 Main St Unit 154
- 5335 Main St Unit 187
- 4973 Forsythia St
- 205 S 54th (#11) St Unit 11
- 5024 Cedar View Dr
- 5335 Daisy St Unit 131
- 5292 Squirrel St
- 205 S 54th St
- 5570 B St
- 4908 Holly St
- 4942 Holly St
Your Personal Tour Guide
Ask me questions while you tour the home.