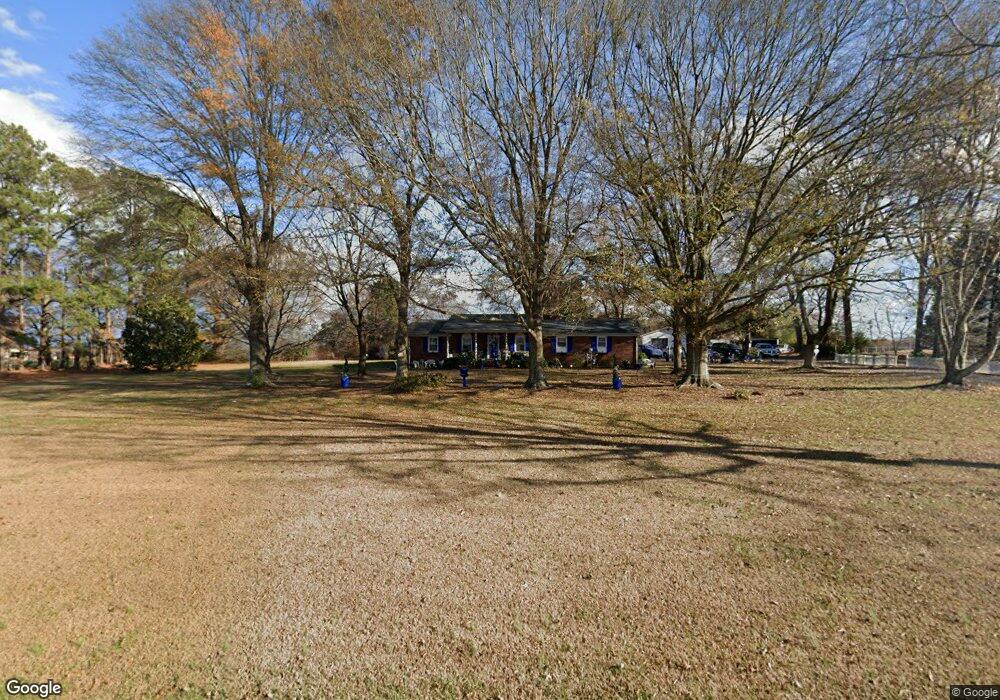
5112 Parris Bridge Rd Boiling Springs, SC 29316
Estimated Value: $308,000 - $368,000
3
Beds
2
Baths
2,030
Sq Ft
$167/Sq Ft
Est. Value
About This Home
This home is located at 5112 Parris Bridge Rd, Boiling Springs, SC 29316 and is currently estimated at $338,667, approximately $166 per square foot. 5112 Parris Bridge Rd is a home located in Spartanburg County with nearby schools including Carlisle-Foster's Grove Elementary School, Rainbow Lake Middle School, and Boiling Springs High School.
Ownership History
Date
Name
Owned For
Owner Type
Purchase Details
Closed on
May 29, 2025
Sold by
Koehler Jutta S and Koehler Jutta I
Bought by
Jutta I D Koehler Revocable Trust and Koehler
Current Estimated Value
Purchase Details
Closed on
Oct 4, 2021
Sold by
Koehler Jutta S
Bought by
Koehler Jutta S and Koehler Peter M
Purchase Details
Closed on
Jul 7, 2021
Sold by
Hughey Todd Defoy and Hughey Rodney Walker
Bought by
Kochler Jutta S
Home Financials for this Owner
Home Financials are based on the most recent Mortgage that was taken out on this home.
Original Mortgage
$1,000,000
Interest Rate
2.96%
Mortgage Type
Future Advance Clause Open End Mortgage
Purchase Details
Closed on
Dec 13, 2007
Sold by
Clary Montie S and Hughey Montie Samantha Seay
Bought by
Hughey Todd Defoy and Hughey Rodney Walker
Create a Home Valuation Report for This Property
The Home Valuation Report is an in-depth analysis detailing your home's value as well as a comparison with similar homes in the area
Home Values in the Area
Average Home Value in this Area
Purchase History
| Date | Buyer | Sale Price | Title Company |
|---|---|---|---|
| Jutta I D Koehler Revocable Trust | -- | None Listed On Document | |
| Koehler Jutta S | -- | None Available | |
| Kochler Jutta S | $255,000 | None Available | |
| Hughey Todd Defoy | -- | None Available |
Source: Public Records
Mortgage History
| Date | Status | Borrower | Loan Amount |
|---|---|---|---|
| Previous Owner | Kochler Jutta S | $1,000,000 |
Source: Public Records
Tax History Compared to Growth
Tax History
| Year | Tax Paid | Tax Assessment Tax Assessment Total Assessment is a certain percentage of the fair market value that is determined by local assessors to be the total taxable value of land and additions on the property. | Land | Improvement |
|---|---|---|---|---|
| 2025 | $5,082 | $13,920 | $3,192 | $10,728 |
| 2024 | $5,082 | $13,920 | $3,192 | $10,728 |
| 2023 | $5,082 | $15,306 | $3,192 | $12,114 |
| 2022 | $5,828 | $15,300 | $2,214 | $13,086 |
| 2021 | $3,775 | $9,846 | $2,214 | $7,632 |
| 2020 | $3,748 | $9,846 | $2,214 | $7,632 |
| 2019 | $3,736 | $6,564 | $1,476 | $5,088 |
| 2018 | $810 | $6,564 | $1,476 | $5,088 |
| 2017 | $697 | $5,872 | $1,416 | $4,456 |
| 2016 | $694 | $5,872 | $1,416 | $4,456 |
| 2015 | $687 | $5,872 | $1,416 | $4,456 |
| 2014 | $680 | $5,872 | $1,416 | $4,456 |
Source: Public Records
Map
Nearby Homes
- 198 Blease Horton Rd
- 4943 Parris Bridge Rd
- 608 Berry Rd
- 423 Josie Way
- 441 Josie Way
- 781 Berry Rd
- 5419 Parris Bridge Rd
- 9035 Germaine Ct
- 7085 Luna Mae Ct
- 130 Brim Ct
- 5435 Parris Bridge Rd
- 1073 Corie Crest Dr
- 272 Heather Glen Dr
- 280 Heather Glen Dr
- 1004 S November Dr
- 3006 Old Furnace Rd
- 236 Summer Lady Ln
- 7239 Clemie Ct
- 575 Mountainview Rd
- 3550 Old Furnace Rd
- 5104 Parris Bridge Rd
- 5120 Parris Bridge Rd
- 5103 Parris Bridge Rd
- 5020 Parris Bridge Rd
- 5119 Parris Bridge Rd
- 5021 Parris Bridge Rd
- 5123 Parris Bridge Rd
- 5014 Parris Bridge Rd
- 5015 Parris Bridge Rd
- 5129 Parris Bridge Rd
- 5011 Parris Bridge Rd
- 5007 Parris Bridge Rd
- 5055 Parris Bridge Rd
- 5133 Parris Bridge Rd
- 4996 Parris Bridge Rd
- 226 State Road S-42-9750
- 198 State Road S-42-9750
- 202 State Road S-42-9750
- 206 State Road S-42-9750
- 214 State Road S-42-9750