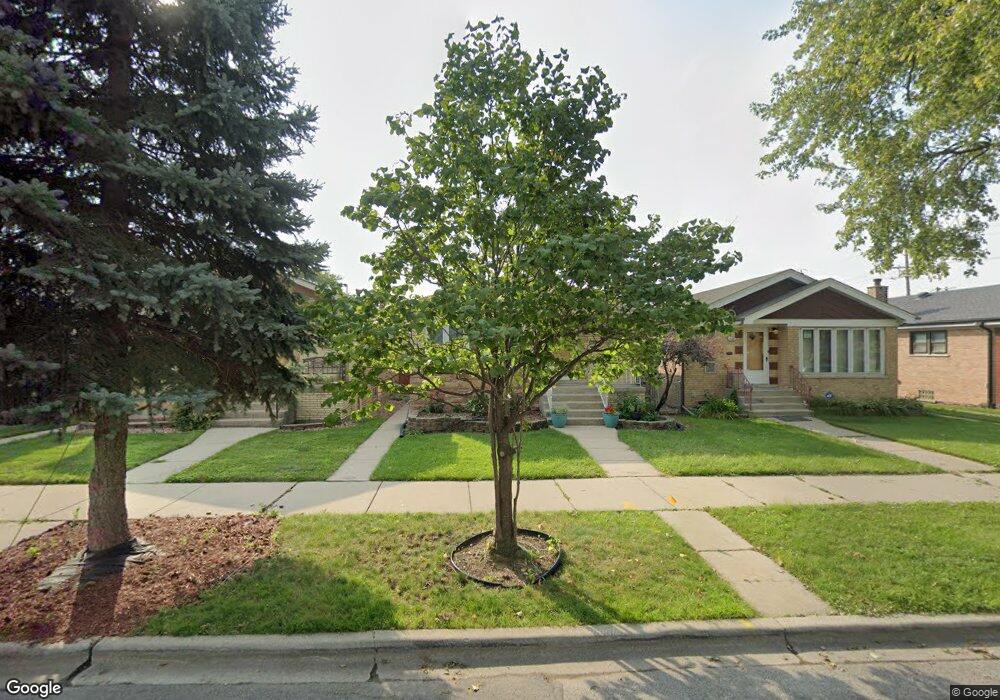
5112 S Austin Ave Chicago, IL 60638
Garfield Ridge NeighborhoodEstimated Value: $289,000 - $388,000
3
Beds
2
Baths
1,118
Sq Ft
$311/Sq Ft
Est. Value
About This Home
This home is located at 5112 S Austin Ave, Chicago, IL 60638 and is currently estimated at $348,152, approximately $311 per square foot. 5112 S Austin Ave is a home located in Cook County with nearby schools including Twain Elementary School, Kennedy High School, and Gloria Dei Lutheran School.
Ownership History
Date
Name
Owned For
Owner Type
Purchase Details
Closed on
Nov 21, 2013
Sold by
Federal Home Loan Mortgage Corporation
Bought by
Juarez Juan M
Current Estimated Value
Home Financials for this Owner
Home Financials are based on the most recent Mortgage that was taken out on this home.
Original Mortgage
$174,800
Interest Rate
4.5%
Mortgage Type
New Conventional
Purchase Details
Closed on
Jul 8, 2013
Sold by
Salgado Irene
Bought by
Federal Home Loan Mortgage Corporation
Purchase Details
Closed on
Jan 23, 2006
Sold by
Delvalle Edgar and Delvalle Del Valle
Bought by
Salgado Irene
Home Financials for this Owner
Home Financials are based on the most recent Mortgage that was taken out on this home.
Original Mortgage
$205,000
Interest Rate
6.2%
Mortgage Type
New Conventional
Purchase Details
Closed on
Oct 22, 1998
Sold by
Cole Taylor Bank
Bought by
Delvalle Edgar and Delvalle Rocio
Home Financials for this Owner
Home Financials are based on the most recent Mortgage that was taken out on this home.
Original Mortgage
$117,000
Interest Rate
6.68%
Create a Home Valuation Report for This Property
The Home Valuation Report is an in-depth analysis detailing your home's value as well as a comparison with similar homes in the area
Home Values in the Area
Average Home Value in this Area
Purchase History
| Date | Buyer | Sale Price | Title Company |
|---|---|---|---|
| Juarez Juan M | $184,000 | Attorneys Title Guaranty Fun | |
| Federal Home Loan Mortgage Corporation | -- | None Available | |
| Salgado Irene | $305,000 | Marquis Title | |
| Delvalle Edgar | $124,000 | -- |
Source: Public Records
Mortgage History
| Date | Status | Borrower | Loan Amount |
|---|---|---|---|
| Previous Owner | Juarez Juan M | $174,800 | |
| Previous Owner | Salgado Irene | $205,000 | |
| Previous Owner | Delvalle Edgar | $117,000 |
Source: Public Records
Tax History Compared to Growth
Tax History
| Year | Tax Paid | Tax Assessment Tax Assessment Total Assessment is a certain percentage of the fair market value that is determined by local assessors to be the total taxable value of land and additions on the property. | Land | Improvement |
|---|---|---|---|---|
| 2024 | $3,751 | $27,000 | $5,586 | $21,414 |
| 2023 | $3,636 | $21,001 | $4,988 | $16,013 |
| 2022 | $3,636 | $21,001 | $4,988 | $16,013 |
| 2021 | $3,553 | $20,999 | $4,987 | $16,012 |
| 2020 | $3,641 | $19,339 | $3,990 | $15,349 |
| 2019 | $3,651 | $21,488 | $3,990 | $17,498 |
| 2018 | $3,589 | $21,488 | $3,990 | $17,498 |
| 2017 | $3,390 | $19,021 | $3,591 | $15,430 |
| 2016 | $3,331 | $19,021 | $3,591 | $15,430 |
| 2015 | $3,027 | $19,021 | $3,591 | $15,430 |
| 2014 | $2,337 | $15,065 | $3,391 | $11,674 |
| 2013 | $2,762 | $15,065 | $3,391 | $11,674 |
Source: Public Records
Map
Nearby Homes
- 5128 S Meade Ave
- 5245 S Mayfield Ave
- 5141 S Merrimac Ave
- 5253 S Mobile Ave
- 5118 S Mobile Ave
- 5108 S Massasoit Ave
- 5417 S Melvina Ave Unit 102
- 5142 S Mulligan Ave
- 5850 W 55th St Unit 3D
- 5248 S Narragansett Ave
- 5421 S Mulligan Ave
- 5127 S Parkside Ave
- 6340 S Archer Ave
- 5250 S Nagle Ave
- 5121 S Central Ave
- 5533 S Menard Ave
- 5621 S Moody Ave
- 5107 S Luna Ave
- 5712 W 56th St
- 5053 S Luna Ave
- 5108 S Austin Ave
- 5118 S Austin Ave
- 5104 S Austin Ave
- 5100 S Austin Ave
- 5124 S Austin Ave
- 5111 S Mcvicker Ave
- 5111 S Mcvicker Ave
- 5115 S Mcvicker Ave
- 5107 S Mcvicker Ave
- 5126 S Austin Ave
- 5119 S Mcvicker Ave
- 5105 S Mcvicker Ave
- 5123 S Mcvicker Ave
- 5101 S Mcvicker Ave
- 5130 S Austin Ave
- 5121 S Austin Ave
- 5125 S Mcvicker Ave
- 5111 S Austin Ave
- 5113 S Austin Ave