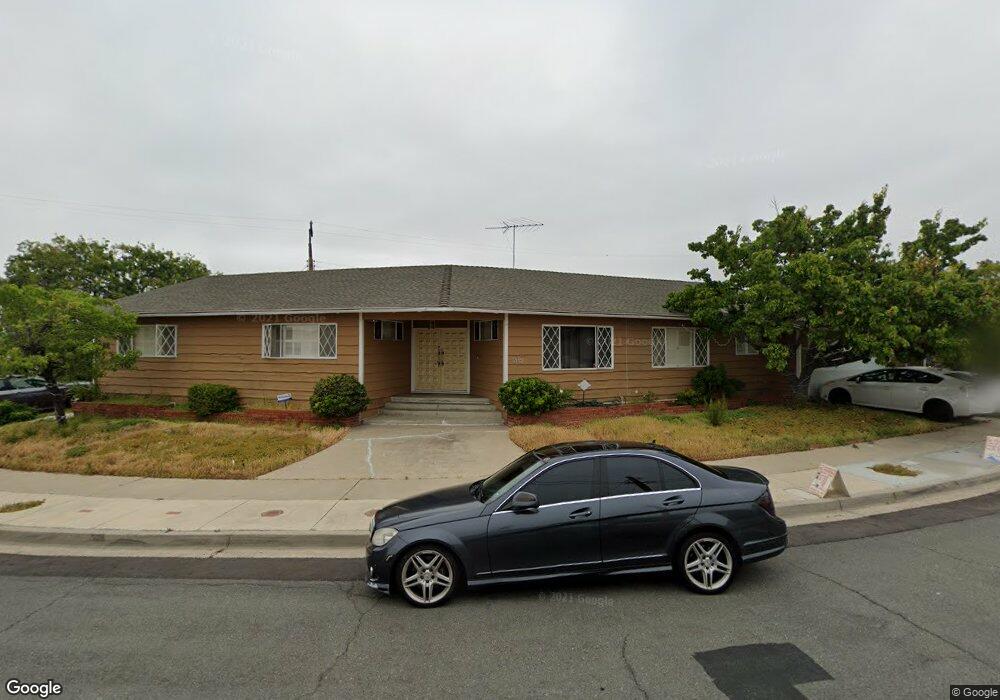
5112 Walsh Way San Diego, CA 92115
College West NeighborhoodEstimated Value: $1,276,265 - $1,432,000
3
Beds
3
Baths
2,248
Sq Ft
$607/Sq Ft
Est. Value
About This Home
This home is located at 5112 Walsh Way, San Diego, CA 92115 and is currently estimated at $1,363,566, approximately $606 per square foot. 5112 Walsh Way is a home located in San Diego County with nearby schools including Hardy Elementary School, Lewis Middle School, and Patrick Henry High School.
Ownership History
Date
Name
Owned For
Owner Type
Purchase Details
Closed on
Mar 26, 2018
Sold by
Vu Brian Tinh V and Vu Diana Dzung
Bought by
Vu Brian Thinh V and Vu Diana Dzung
Current Estimated Value
Purchase Details
Closed on
Apr 22, 2003
Sold by
Vu Brian Tinh V
Bought by
Vu Brian Tinh and Vu Diana Dzung
Purchase Details
Closed on
Oct 29, 2002
Sold by
Vu Diana Dzung
Bought by
Vu Brian Tinh
Home Financials for this Owner
Home Financials are based on the most recent Mortgage that was taken out on this home.
Original Mortgage
$287,000
Outstanding Balance
$120,565
Interest Rate
6.06%
Estimated Equity
$1,243,001
Purchase Details
Closed on
Dec 16, 1999
Sold by
Blumer Raye S Family Trust and Kenneth R
Bought by
Vu Brian Tinh and Vu Diana Dzung
Home Financials for this Owner
Home Financials are based on the most recent Mortgage that was taken out on this home.
Original Mortgage
$237,600
Interest Rate
7.69%
Create a Home Valuation Report for This Property
The Home Valuation Report is an in-depth analysis detailing your home's value as well as a comparison with similar homes in the area
Home Values in the Area
Average Home Value in this Area
Purchase History
| Date | Buyer | Sale Price | Title Company |
|---|---|---|---|
| Vu Brian Thinh V | -- | None Available | |
| Vu Brian Tinh | -- | -- | |
| Vu Brian Tinh | -- | Old Republic Title Company | |
| Vu Brian Tinh | $297,000 | Chicago Title Co |
Source: Public Records
Mortgage History
| Date | Status | Borrower | Loan Amount |
|---|---|---|---|
| Open | Vu Brian Tinh | $287,000 | |
| Closed | Vu Brian Tinh | $237,600 |
Source: Public Records
Tax History Compared to Growth
Tax History
| Year | Tax Paid | Tax Assessment Tax Assessment Total Assessment is a certain percentage of the fair market value that is determined by local assessors to be the total taxable value of land and additions on the property. | Land | Improvement |
|---|---|---|---|---|
| 2025 | $5,531 | $456,455 | $230,533 | $225,922 |
| 2024 | $5,531 | $447,506 | $226,013 | $221,493 |
| 2023 | $5,408 | $438,732 | $221,582 | $217,150 |
| 2022 | $5,265 | $430,131 | $217,238 | $212,893 |
| 2021 | $5,229 | $421,698 | $212,979 | $208,719 |
| 2020 | $5,166 | $417,375 | $210,796 | $206,579 |
| 2019 | $5,074 | $409,192 | $206,663 | $202,529 |
| 2018 | $4,662 | $401,169 | $202,611 | $198,558 |
| 2017 | $4,550 | $393,304 | $198,639 | $194,665 |
| 2016 | $4,475 | $385,594 | $194,745 | $190,849 |
| 2015 | $4,408 | $379,803 | $191,820 | $187,983 |
| 2014 | $4,338 | $372,364 | $188,063 | $184,301 |
Source: Public Records
Map
Nearby Homes
- 5665 Toyon Rd Unit 27
- 5055 Collwood Blvd Unit 319
- 5045 Collwood Way Unit 33
- 5432 Adobe Falls Rd Unit 12
- 5452 Adobe Falls Rd Unit 2
- 5513 Adobe Falls Rd Unit 11
- 4664 Yerba Santa Dr
- 4940 Defiance Way
- 4881 Collwood Blvd Unit A
- 4881 Collwood Blvd Unit B
- 4891 Collwood Blvd Unit B
- 5228 Augustana Place
- 5540 Lindo Paseo Unit 19
- 4931 Lorraine Dr
- 4768 Caroline Dr
- 4613 Janet Place
- 4848 54th St
- 4701 Elsa Rd
- 5483 Maisel Way
- 4810 Baylor Dr
- 5105 Remington Rd
- 5138 Walsh Way
- 5117 Remington Rd
- 5115 Walsh Way
- 5127 Walsh Way
- 5105 Walsh Way
- 5152 Walsh Way
- 5129 Remington Rd
- 5396 Drover Dr
- 5139 Walsh Way
- 5402 Drover Dr
- 5104 Remington Rd
- 5164 Walsh Way
- 5141 Remington Rd
- 5151 Walsh Way Unit 5
- 5128 Remington Rd
- 5116 Remington Rd
- 5163 Walsh Way
- 5140 Remington Rd
- 5174 Walsh Way