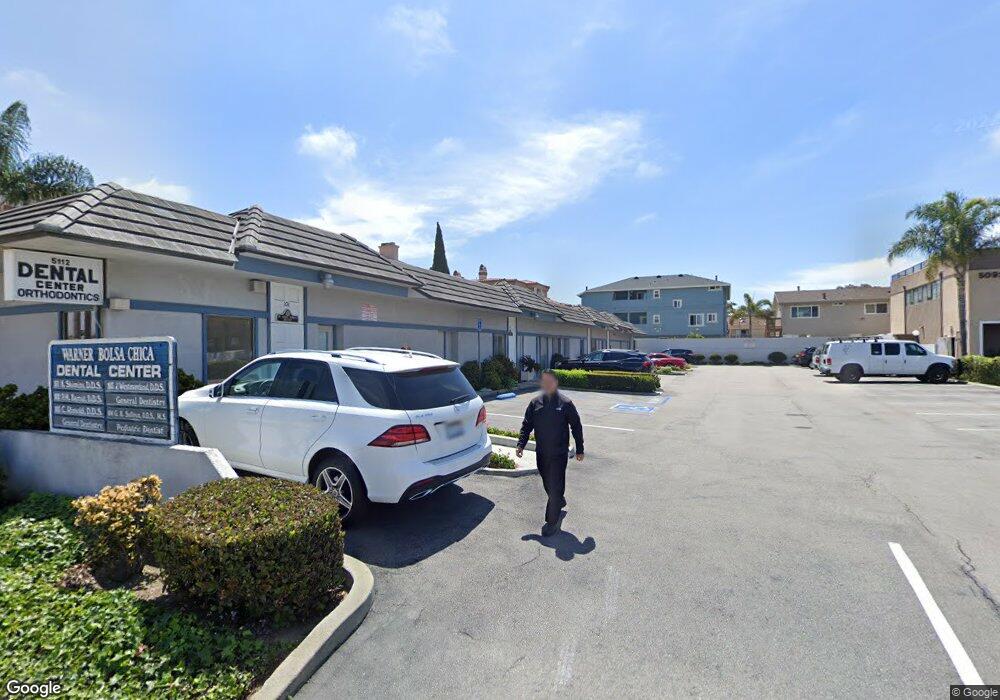
5112 Warner Ave Unit 102 Huntington Beach, CA 92649
--
Bed
--
Bath
4,710
Sq Ft
8,712
Sq Ft Lot
About This Home
This home is located at 5112 Warner Ave Unit 102, Huntington Beach, CA 92649. 5112 Warner Ave Unit 102 is a home located in Orange County with nearby schools including Harbour View Elementary School, Marine View Middle, and Huntington Beach High School.
Ownership History
Date
Name
Owned For
Owner Type
Purchase Details
Closed on
Mar 15, 2011
Sold by
Wei Yin Tsen and Wei Terry
Bought by
Wei Yin Tsen and Wei Terry
Purchase Details
Closed on
Jan 8, 2002
Sold by
Westmoreland John William and Westmoreland Carla Ann
Bought by
Wei Yin Tsen and Wei Terry
Home Financials for this Owner
Home Financials are based on the most recent Mortgage that was taken out on this home.
Original Mortgage
$490,000
Interest Rate
5.5%
Mortgage Type
Commercial
Purchase Details
Closed on
Jun 18, 1997
Sold by
Westmoreland Jeffrey C
Bought by
Westmoreland John William and Westmoreland Carla Ann
Home Financials for this Owner
Home Financials are based on the most recent Mortgage that was taken out on this home.
Original Mortgage
$410,000
Interest Rate
7.93%
Mortgage Type
Commercial
Create a Home Valuation Report for This Property
The Home Valuation Report is an in-depth analysis detailing your home's value as well as a comparison with similar homes in the area
Home Values in the Area
Average Home Value in this Area
Purchase History
| Date | Buyer | Sale Price | Title Company |
|---|---|---|---|
| Wei Yin Tsen | -- | None Available | |
| Wei Yin Tsen | $790,000 | Commonwealth Title | |
| Westmoreland John William | $660,000 | First American Title Ins Co | |
| Westmoreland Jeffrey C | -- | First American Title Ins Co |
Source: Public Records
Mortgage History
| Date | Status | Borrower | Loan Amount |
|---|---|---|---|
| Previous Owner | Wei Yin Tsen | $490,000 | |
| Previous Owner | Westmoreland John William | $410,000 |
Source: Public Records
Tax History Compared to Growth
Tax History
| Year | Tax Paid | Tax Assessment Tax Assessment Total Assessment is a certain percentage of the fair market value that is determined by local assessors to be the total taxable value of land and additions on the property. | Land | Improvement |
|---|---|---|---|---|
| 2025 | $10,593 | $782,961 | $369,327 | $413,634 |
| 2024 | $10,593 | $767,609 | $362,085 | $405,524 |
| 2023 | $10,332 | $752,558 | $354,985 | $397,573 |
| 2022 | $10,155 | $737,802 | $348,024 | $389,778 |
| 2021 | $9,980 | $723,336 | $341,200 | $382,136 |
| 2020 | $9,869 | $715,920 | $337,702 | $378,218 |
| 2019 | $9,725 | $701,883 | $331,081 | $370,802 |
| 2018 | $9,523 | $688,121 | $324,589 | $363,532 |
| 2017 | $9,379 | $674,629 | $318,225 | $356,404 |
| 2016 | $9,039 | $661,401 | $311,985 | $349,416 |
| 2015 | $8,902 | $651,467 | $307,299 | $344,168 |
| 2014 | $8,730 | $638,706 | $301,279 | $337,427 |
Source: Public Records
Map
Nearby Homes
- 17191 Corbina Ln Unit 110
- 5241 Glenroy Dr
- 17202 Corbina Ln Unit 108
- 5262 Glenroy Dr
- 16832 Roosevelt Ln
- 4822 Tiara Dr Unit 104
- 16771 Green Ln
- 17352 Eucalyptus Ln
- 17212 Lynn Ln
- 17291 Wareham Ln
- 17272 Tidalridge Ln
- 17322 Wareham Ln
- 4682 Warner Ave Unit B102
- 5200 Heil Ave Unit 18
- 5200 Heil Ave Unit 8
- 17182 Hillside Cir
- 4822 Neely Cir
- 17042 Twain Ln
- 4711 Winthrop Dr
- 16581 Grunion Unit 204
- 5142 Warner Ave
- 5142 Warner Ave Unit 205
- 5142 Warner Ave Unit 309
- 5142 Warner Ave Unit 305
- 5142 Warner Ave Unit 206
- 5142 Warner Ave Unit 312
- 5142 Warner Ave Unit 300
- 5142 Warner Ave Unit 203
- 5142 Warner Ave Unit 212
- 5142 Warner Ave Unit 202
- 5142 Warner Ave Unit 210
- 5142 Warner Ave Unit 204
- 5142 Warner Ave Unit 101
- 5142 Warner Ave Unit 200
- 5142 Warner Ave Unit 207
- 5142 Warner Ave Unit 307
- 5142 Warner Ave Unit 303
- 5142 Warner Ave Unit 108
- 5142 Warner Ave Unit 211
- 5142 Warner Ave Unit 104