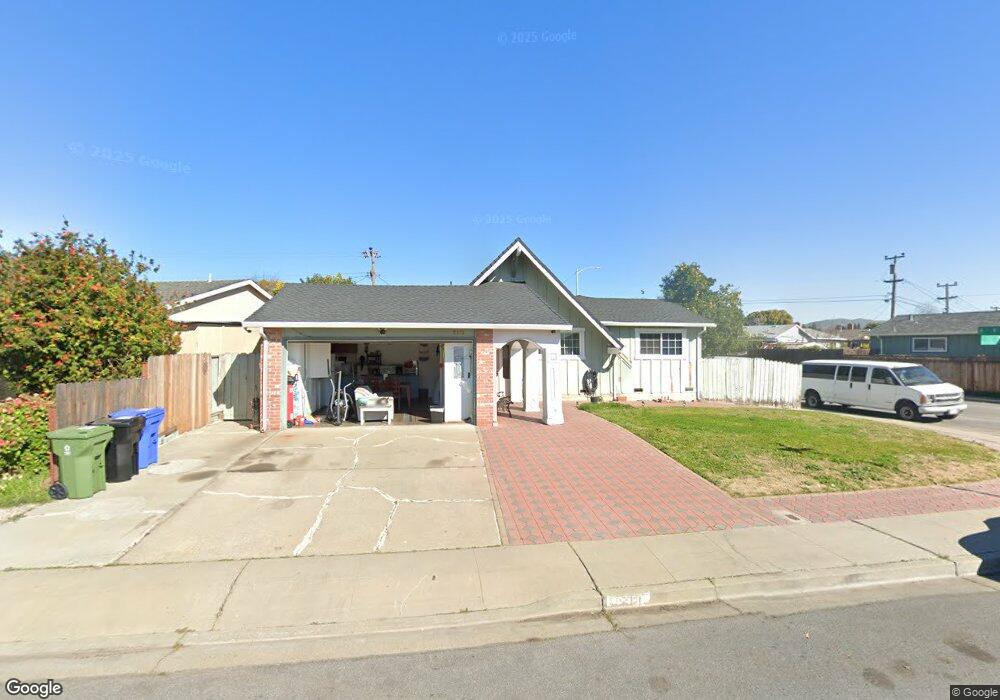
5113 Everglades Park Dr Fremont, CA 94538
Blacow NeighborhoodEstimated Value: $1,182,000 - $1,702,000
3
Beds
2
Baths
1,512
Sq Ft
$962/Sq Ft
Est. Value
About This Home
This home is located at 5113 Everglades Park Dr, Fremont, CA 94538 and is currently estimated at $1,454,937, approximately $962 per square foot. 5113 Everglades Park Dr is a home located in Alameda County with nearby schools including Steven Millard Elementary, G.M. Walters Middle School, and John F. Kennedy High School.
Ownership History
Date
Name
Owned For
Owner Type
Purchase Details
Closed on
Jun 4, 2004
Sold by
Singh Rajinder Pal and Kaur Sukhwinder
Bought by
Singh Swarn and Kaur Paramjit
Current Estimated Value
Home Financials for this Owner
Home Financials are based on the most recent Mortgage that was taken out on this home.
Original Mortgage
$206,000
Outstanding Balance
$86,181
Interest Rate
3.88%
Mortgage Type
Purchase Money Mortgage
Estimated Equity
$1,368,756
Purchase Details
Closed on
Mar 18, 1998
Sold by
Cassalia Gregory and Cassalia Patricia
Bought by
Singh Rajinder Pal and Kaur Sukhwinder
Home Financials for this Owner
Home Financials are based on the most recent Mortgage that was taken out on this home.
Original Mortgage
$196,800
Interest Rate
7.06%
Create a Home Valuation Report for This Property
The Home Valuation Report is an in-depth analysis detailing your home's value as well as a comparison with similar homes in the area
Home Values in the Area
Average Home Value in this Area
Purchase History
| Date | Buyer | Sale Price | Title Company |
|---|---|---|---|
| Singh Swarn | $103,000 | North American Title Company | |
| Singh Rajinder Pal | $246,000 | Financial Title Company |
Source: Public Records
Mortgage History
| Date | Status | Borrower | Loan Amount |
|---|---|---|---|
| Open | Singh Swarn | $206,000 | |
| Closed | Singh Rajinder Pal | $196,800 |
Source: Public Records
Tax History Compared to Growth
Tax History
| Year | Tax Paid | Tax Assessment Tax Assessment Total Assessment is a certain percentage of the fair market value that is determined by local assessors to be the total taxable value of land and additions on the property. | Land | Improvement |
|---|---|---|---|---|
| 2025 | $5,110 | $385,780 | $117,834 | $274,946 |
| 2024 | $5,110 | $378,080 | $115,524 | $269,556 |
| 2023 | $4,960 | $377,530 | $113,259 | $264,271 |
| 2022 | $4,877 | $363,128 | $111,038 | $259,090 |
| 2021 | $4,762 | $355,871 | $108,861 | $254,010 |
| 2020 | $4,717 | $359,151 | $107,745 | $251,406 |
| 2019 | $4,666 | $352,111 | $105,633 | $246,478 |
| 2018 | $4,572 | $345,208 | $103,562 | $241,646 |
| 2017 | $4,457 | $338,441 | $101,532 | $236,909 |
| 2016 | $4,371 | $331,807 | $99,542 | $232,265 |
| 2015 | $4,304 | $326,822 | $98,046 | $228,776 |
| 2014 | $4,223 | $320,421 | $96,126 | $224,295 |
Source: Public Records
Map
Nearby Homes
- 43163 Grimmer Terrace
- 48 Eagle Green
- 5560 Boscell Common
- 92 Delta Green
- 4860 Bryce Canyon Park Dr
- 42932 Peachwood St
- 4537 Capewood Terrace
- 4533 Capewood Terrace
- 5341 Audubon Park Ct
- 202 Manitoba Terrace
- 208 Manitoba Terrace
- 262 Manitoba Green
- 261 Manitoba Green Unit 261
- 257 Manitoba Green
- 4309 Bora Ave
- 4751 Wadsworth Ct
- 41882 Gifford St
- 40696 Robin St
- 40422 Landon Ave
- 42759 Newport Dr
- 43096 Everglades Park Dr
- 5002 Yellowstone Park Dr
- 4993 Everglades Park Dr
- 43088 Everglades Park Dr
- 5012 Yellowstone Park Dr
- 5112 Everglades Park Dr
- 4984 Yellowstone Park Dr
- 5006 Everglades Park Dr
- 43079 Everglades Park Dr
- 4987 Everglades Park Dr
- 43080 Everglades Park Dr
- 4998 Everglades Park Dr
- 5018 Yellowstone Park Dr
- 43073 Everglades Park Dr
- 4978 Yellowstone Park Dr
- 43067 Everglades Park Dr
- 4994 Everglades Park Dr
- 4981 Everglades Park Dr
- 43072 Everglades Park Dr
- 5003 Yellowstone Park Dr