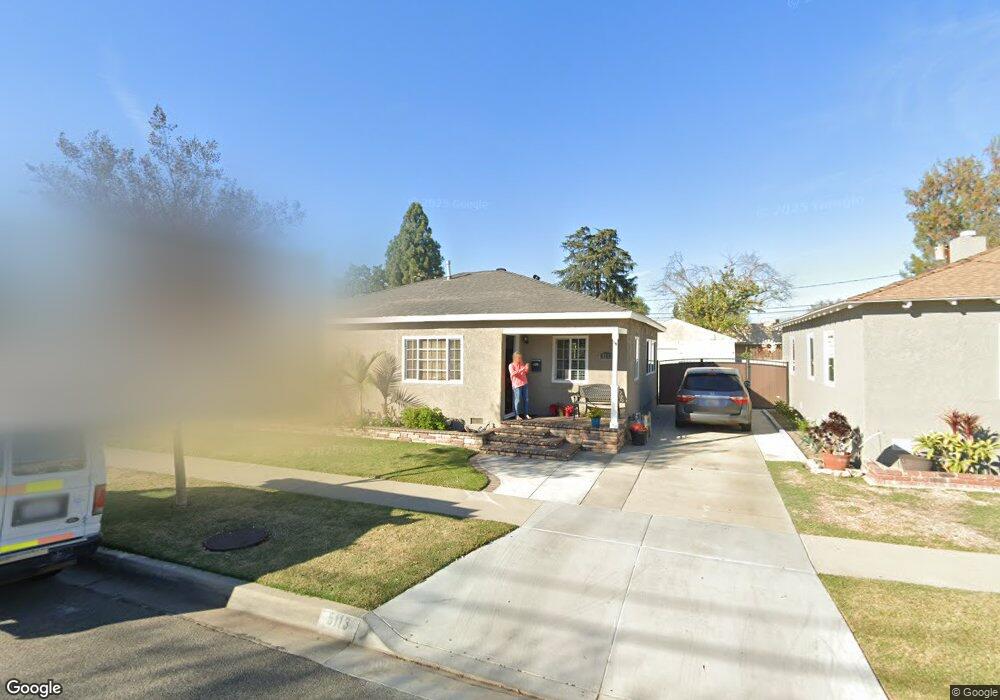
5113 Hedda St Lakewood, CA 90712
Mayfair NeighborhoodEstimated Value: $831,000 - $904,708
3
Beds
1
Bath
1,118
Sq Ft
$775/Sq Ft
Est. Value
About This Home
This home is located at 5113 Hedda St, Lakewood, CA 90712 and is currently estimated at $866,177, approximately $774 per square foot. 5113 Hedda St is a home located in Los Angeles County with nearby schools including Craig Williams Elementary School, Mayfair High School, and St. Bernard School.
Ownership History
Date
Name
Owned For
Owner Type
Purchase Details
Closed on
Jun 25, 2012
Sold by
Scholte Eric B
Bought by
Scholte Eric B and Scholte Jennifer L
Current Estimated Value
Home Financials for this Owner
Home Financials are based on the most recent Mortgage that was taken out on this home.
Original Mortgage
$284,000
Outstanding Balance
$196,690
Interest Rate
3.74%
Mortgage Type
New Conventional
Estimated Equity
$669,487
Purchase Details
Closed on
Nov 6, 2009
Sold by
Jones Michael R
Bought by
Scholte Eric B and Scholte Jenifer L
Home Financials for this Owner
Home Financials are based on the most recent Mortgage that was taken out on this home.
Original Mortgage
$288,800
Interest Rate
4.88%
Mortgage Type
New Conventional
Purchase Details
Closed on
Feb 11, 1999
Sold by
Johnson Johnson W
Bought by
Jones Michael R and Jones Deborah
Home Financials for this Owner
Home Financials are based on the most recent Mortgage that was taken out on this home.
Original Mortgage
$184,459
Interest Rate
6.73%
Mortgage Type
FHA
Create a Home Valuation Report for This Property
The Home Valuation Report is an in-depth analysis detailing your home's value as well as a comparison with similar homes in the area
Home Values in the Area
Average Home Value in this Area
Purchase History
| Date | Buyer | Sale Price | Title Company |
|---|---|---|---|
| Scholte Eric B | -- | First American Title Company | |
| Scholte Eric B | $361,000 | North American Title Company | |
| Jones Michael R | $186,000 | Lawyers Title Company | |
| Johnson Weston G | -- | Continental Title |
Source: Public Records
Mortgage History
| Date | Status | Borrower | Loan Amount |
|---|---|---|---|
| Open | Scholte Eric B | $284,000 | |
| Previous Owner | Scholte Eric B | $288,800 | |
| Previous Owner | Jones Michael R | $184,459 |
Source: Public Records
Tax History Compared to Growth
Tax History
| Year | Tax Paid | Tax Assessment Tax Assessment Total Assessment is a certain percentage of the fair market value that is determined by local assessors to be the total taxable value of land and additions on the property. | Land | Improvement |
|---|---|---|---|---|
| 2025 | $5,661 | $465,969 | $372,782 | $93,187 |
| 2024 | $5,661 | $456,833 | $365,473 | $91,360 |
| 2023 | $5,430 | $447,876 | $358,307 | $89,569 |
| 2022 | $5,326 | $439,095 | $351,282 | $87,813 |
| 2021 | $5,211 | $430,487 | $344,395 | $86,092 |
| 2019 | $5,075 | $417,721 | $334,181 | $83,540 |
| 2018 | $4,875 | $409,531 | $327,629 | $81,902 |
| 2016 | $4,681 | $393,630 | $314,907 | $78,723 |
| 2015 | $4,584 | $387,718 | $310,177 | $77,541 |
| 2014 | $4,523 | $380,125 | $304,102 | $76,023 |
Source: Public Records
Map
Nearby Homes
- 6103 Sunfield Ave
- 5817 Fidler Ave
- 6049 Pennswood Ave
- 5134 Ashworth St
- 6139 Pearce Ave
- 6107 Faculty Ave
- 5839 Faculty Ave
- 5968 Blackthorne Ave
- 5944 Blackthorne Ave
- 9253 Rose St
- 5609 Clark Ave
- 4342 Arabella St
- 6034 Pepperwood Ave
- 6138 Pepperwood Ave
- 5503 Sunfield Ave
- 9513 Cedar St
- 6127 Adenmoor Ave
- 9112 Cedar St
- 5860 Adenmoor Ave
- 5538 Autry Ave
- 5109 Hedda St
- 5119 Hedda St
- 5123 Hedda St
- 5101 Hedda St
- 5129 Hedda St
- 5963 Dagwood Ave
- 5964 Clark Ave
- 5133 Hedda St
- 5959 Dagwood Ave
- 5958 Clark Ave
- 5139 Hedda St
- 5953 Dagwood Ave
- 5952 Clark Ave
- 5046 La Jara Ct
- 5132 Hedda St
- 5956 Dagwood Ave
- 5949 Dagwood Ave
- 5948 Clark Ave
- 5963 Clark Ave
- 5042 La Jara Ct