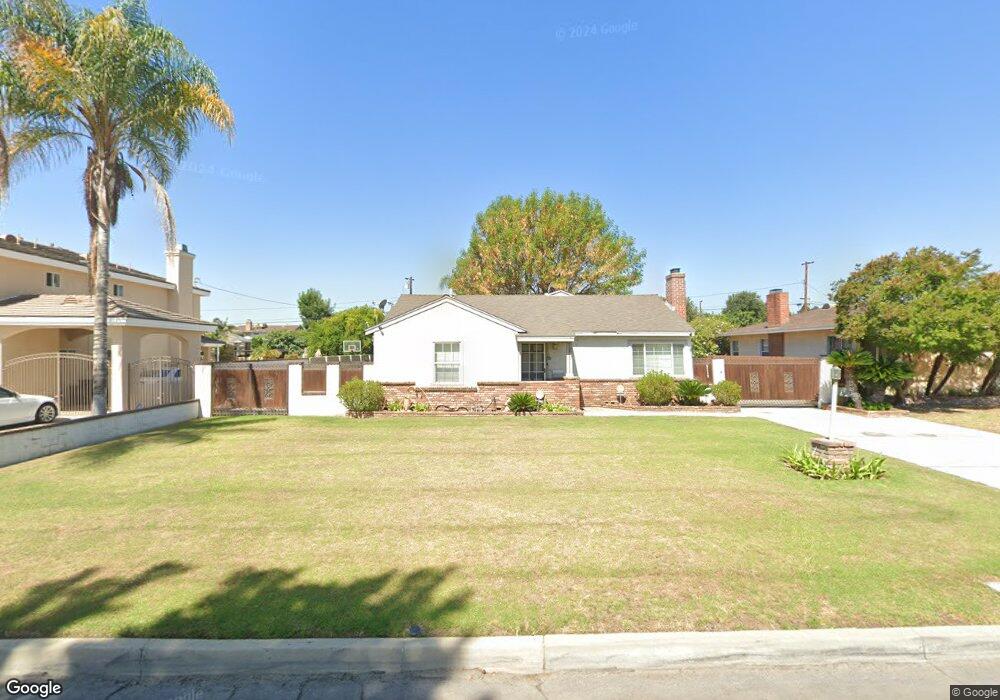
5113 Mcclintock Ave Temple City, CA 91780
Estimated Value: $1,096,000 - $1,254,000
3
Beds
2
Baths
2,003
Sq Ft
$596/Sq Ft
Est. Value
About This Home
This home is located at 5113 Mcclintock Ave, Temple City, CA 91780 and is currently estimated at $1,193,296, approximately $595 per square foot. 5113 Mcclintock Ave is a home located in Los Angeles County with nearby schools including Cleminson Elementary School, Rio Hondo School, and Arroyo High School.
Ownership History
Date
Name
Owned For
Owner Type
Purchase Details
Closed on
Aug 2, 2017
Sold by
Chan Yue Ying
Bought by
Chan Karen Yue Ying and Karen Yue Ying Chan Living Trust
Current Estimated Value
Purchase Details
Closed on
Jun 20, 2006
Sold by
Chan Yee Kim
Bought by
Chan Yue Ying
Purchase Details
Closed on
Jan 28, 2004
Sold by
Chan Yee Kim and Chan Yue Ying
Bought by
Chan Yue Ying
Home Financials for this Owner
Home Financials are based on the most recent Mortgage that was taken out on this home.
Original Mortgage
$277,000
Interest Rate
5.8%
Mortgage Type
New Conventional
Purchase Details
Closed on
Mar 20, 2003
Sold by
Thompson Donald K and Thompson Gloria Jean
Bought by
Chan Yee Kim
Home Financials for this Owner
Home Financials are based on the most recent Mortgage that was taken out on this home.
Original Mortgage
$280,000
Interest Rate
5.79%
Create a Home Valuation Report for This Property
The Home Valuation Report is an in-depth analysis detailing your home's value as well as a comparison with similar homes in the area
Home Values in the Area
Average Home Value in this Area
Purchase History
| Date | Buyer | Sale Price | Title Company |
|---|---|---|---|
| Chan Karen Yue Ying | -- | None Available | |
| Chan Yue Ying | -- | None Available | |
| Chan Yue Ying | -- | United Title Company/La | |
| Chan Yee Kim | $430,000 | United Title Company |
Source: Public Records
Mortgage History
| Date | Status | Borrower | Loan Amount |
|---|---|---|---|
| Previous Owner | Chan Yue Ying | $277,000 | |
| Previous Owner | Chan Yee Kim | $280,000 |
Source: Public Records
Tax History
| Year | Tax Paid | Tax Assessment Tax Assessment Total Assessment is a certain percentage of the fair market value that is determined by local assessors to be the total taxable value of land and additions on the property. | Land | Improvement |
|---|---|---|---|---|
| 2025 | $7,876 | $622,761 | $466,354 | $156,407 |
| 2024 | $7,876 | $610,551 | $457,210 | $153,341 |
| 2023 | $7,733 | $598,581 | $448,246 | $150,335 |
| 2022 | $7,492 | $586,845 | $439,457 | $147,388 |
| 2021 | $7,328 | $575,340 | $430,841 | $144,499 |
| 2019 | $7,450 | $558,277 | $418,063 | $140,214 |
| 2018 | $7,235 | $547,331 | $409,866 | $137,465 |
| 2016 | $6,926 | $526,079 | $393,951 | $132,128 |
| 2015 | $6,854 | $518,178 | $388,034 | $130,144 |
| 2014 | $6,567 | $508,028 | $380,433 | $127,595 |
Source: Public Records
Map
Nearby Homes
- 4951 Mcclintock Ave
- 5138 Daleview Ave
- 4928 El Monte Ave
- 4800 Daleview Ave Unit 121
- 4800 Daleview Ave Unit 41
- 4800 Daleview Ave Unit 85
- 4800 Daleview Ave Unit 18
- 5133 Pal Mal Ave
- 5436 Mcculloch Ave Unit F
- 5122 Halifax Rd
- 10660 Daines Dr
- 5111 Halifax Rd
- 5224 Hallowell Ave
- 5530 Welland Ave Unit 14
- 5533 Santa Anita Ave
- 10531 Mulhall St
- 11036 Lower Azusa Rd
- 4825 Arden Dr
- 4577 Ranger Ave
- 5001 Glickman Ave
- 5103 Mcclintock Ave
- 5119 Mcclintock Ave
- 5125 Mcclintock Ave
- 5035 Mcclintock Ave
- 5131 Mcclintock Ave
- 5110 Mcclintock Ave
- 5102 Persimmon Ave
- 5029 Mcclintock Ave
- 5044 Persimmon Ave
- 5104 Mcclintock Ave
- 5118 Mcclintock Ave
- 5108 Persimmon Ave
- 5038 Persimmon Ave
- 5137 Mcclintock Ave
- 5124 Mcclintock Ave
- 5114 Persimmon Ave
- 5034 Mcclintock Ave
- 5032 Persimmon Ave
- 5128 Mcclintock Ave
- 5120 Persimmon Ave
Your Personal Tour Guide
Ask me questions while you tour the home.