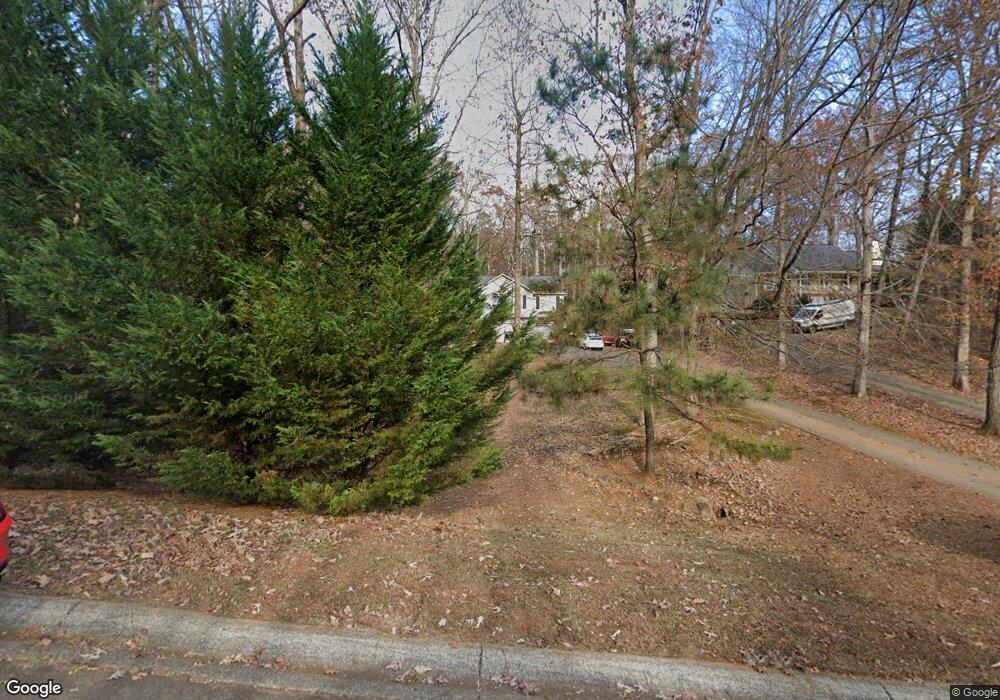
5113 Peach Mountain Cir Gainesville, GA 30507
Estimated Value: $365,000 - $368,468
4
Beds
3
Baths
1,783
Sq Ft
$206/Sq Ft
Est. Value
About This Home
This home is located at 5113 Peach Mountain Cir, Gainesville, GA 30507 and is currently estimated at $366,867, approximately $205 per square foot. 5113 Peach Mountain Cir is a home located in Hall County with nearby schools including Myers Elementary School, Cherokee Bluff Middle School, and Cherokee Bluff High School.
Ownership History
Date
Name
Owned For
Owner Type
Purchase Details
Closed on
Dec 3, 2008
Sold by
Fannie Mae
Bought by
Jones David and Jones Jennifer
Current Estimated Value
Home Financials for this Owner
Home Financials are based on the most recent Mortgage that was taken out on this home.
Original Mortgage
$133,277
Outstanding Balance
$89,131
Interest Rate
6.38%
Mortgage Type
FHA
Estimated Equity
$277,736
Purchase Details
Closed on
Aug 5, 2008
Sold by
Bank Of America Na
Bought by
Federal National Mortgage Association
Purchase Details
Closed on
Mar 12, 2004
Sold by
Hunt John
Bought by
Hunt John and Hunt Stacey C
Purchase Details
Closed on
Jul 19, 2002
Sold by
Mcmillan Bryan Wade
Bought by
Hunt John
Create a Home Valuation Report for This Property
The Home Valuation Report is an in-depth analysis detailing your home's value as well as a comparison with similar homes in the area
Home Values in the Area
Average Home Value in this Area
Purchase History
| Date | Buyer | Sale Price | Title Company |
|---|---|---|---|
| Jones David | -- | -- | |
| Federal National Mortgage Association | -- | -- | |
| Bank Of America Na | $107,622 | -- | |
| Hunt John | -- | -- | |
| Hunt John | $25,000 | -- |
Source: Public Records
Mortgage History
| Date | Status | Borrower | Loan Amount |
|---|---|---|---|
| Open | Jones David | $133,277 |
Source: Public Records
Tax History Compared to Growth
Tax History
| Year | Tax Paid | Tax Assessment Tax Assessment Total Assessment is a certain percentage of the fair market value that is determined by local assessors to be the total taxable value of land and additions on the property. | Land | Improvement |
|---|---|---|---|---|
| 2024 | $3,344 | $132,240 | $25,680 | $106,560 |
| 2023 | $3,192 | $141,400 | $25,680 | $115,720 |
| 2022 | $3,094 | $116,840 | $25,680 | $91,160 |
| 2021 | $2,149 | $78,640 | $6,080 | $72,560 |
| 2020 | $2,125 | $75,600 | $6,080 | $69,520 |
| 2019 | $2,023 | $71,240 | $6,080 | $65,160 |
| 2018 | $1,860 | $63,200 | $6,080 | $57,120 |
| 2017 | $1,344 | $45,384 | $5,480 | $39,904 |
| 2016 | $1,314 | $45,384 | $5,480 | $39,904 |
| 2015 | $1,406 | $45,384 | $5,480 | $39,904 |
| 2014 | $1,406 | $45,384 | $5,480 | $39,904 |
Source: Public Records
Map
Nearby Homes
- 4947 Weaver Rd
- 5074 Peach Mountain Cir
- 5055 Peach Mountain Cir
- 5116 Deer Path Ln
- 3016 Candler Rd
- 3263 Tanners Mill Rd
- 4807 Sherman Allen Rd
- 3325 Tanners Mill Rd
- 7330 Berry Hill Dr
- 4715 Creek Wood Dr
- 1 Cooper Bridge Rd
- 3 Cooper Bridge Rd
- 4745 Shady Lake Cir
- 7367 Berry Hill Dr
- 4813 River Bottom Dr
- 3455 Navigator Ln
- 2820 Glendale Dr
- 2825 Glendale Dr
- 5109 Peach Mountain Cir
- 5117 Peach Mountain Cir
- 5103 Peach Mountain Cir
- 5121 Peach Mountain Cir
- 5099 Peach Mountain Cir
- 5118 Peach Mountain Cir
- 5110 Peach Mountain Cir Unit 10
- 5110 Peach Mountain Cir
- 5095 Peach Mountain Cir
- 5114 Peach Mountain Cir
- 5114 Peach Mountain Cir Unit 11
- 5126 Peach Mountain Cir
- 5106 Peach Mountain Cir
- 5091 Peach Mountain Cir
- 4969 Weaver Rd
- 4969 Weaver Rd Unit 18
- 5087 Peach Mountain Cir
- 5100 Peach Mountain Cir
- 5094 Peach Mountain Cir
- 4975 Weaver Rd