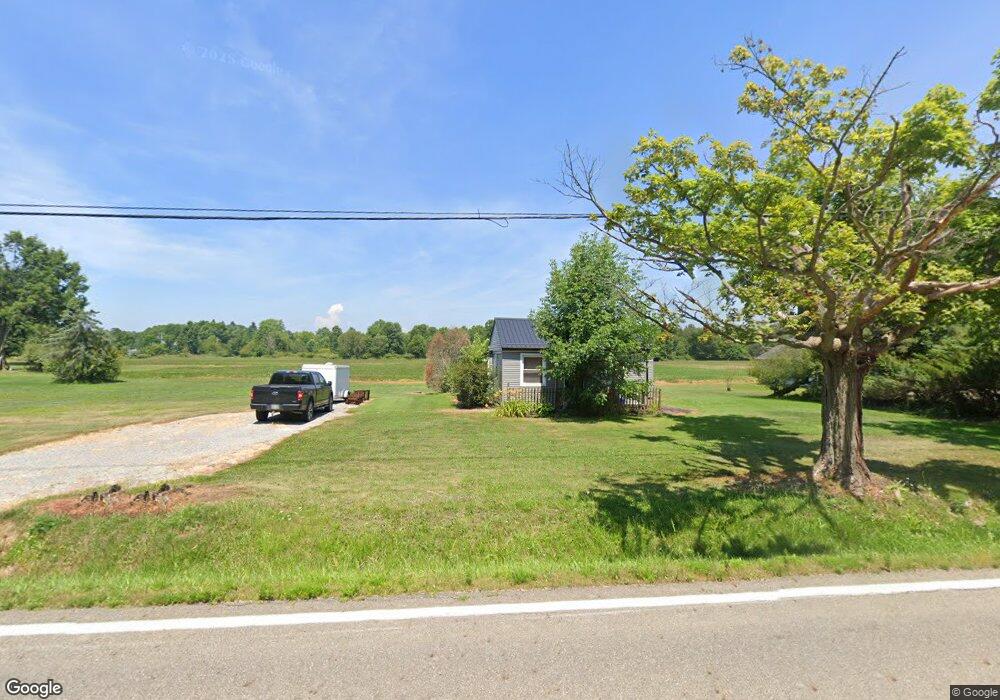
5113 State Route 305 Fowler, OH 44418
Estimated Value: $75,999 - $106,000
2
Beds
1
Bath
680
Sq Ft
$131/Sq Ft
Est. Value
About This Home
This home is located at 5113 State Route 305, Fowler, OH 44418 and is currently estimated at $89,250, approximately $131 per square foot. 5113 State Route 305 is a home located in Trumbull County with nearby schools including Currie Elementary School, Baker Elementary School, and Mathews High School.
Ownership History
Date
Name
Owned For
Owner Type
Purchase Details
Closed on
Dec 21, 2000
Sold by
Murphy Paula Ballas
Bought by
Manser Nicholas C
Current Estimated Value
Purchase Details
Closed on
Nov 14, 1996
Sold by
Moore David J
Bought by
Ballas Paula
Home Financials for this Owner
Home Financials are based on the most recent Mortgage that was taken out on this home.
Original Mortgage
$42,655
Interest Rate
8.18%
Mortgage Type
New Conventional
Purchase Details
Closed on
Jan 1, 1990
Sold by
Nicula John G
Bought by
Mary S Nicula
Create a Home Valuation Report for This Property
The Home Valuation Report is an in-depth analysis detailing your home's value as well as a comparison with similar homes in the area
Purchase History
| Date | Buyer | Sale Price | Title Company |
|---|---|---|---|
| Manser Nicholas C | $54,500 | -- | |
| Ballas Paula | $44,900 | -- | |
| Mary S Nicula | -- | -- |
Source: Public Records
Mortgage History
| Date | Status | Borrower | Loan Amount |
|---|---|---|---|
| Previous Owner | Ballas Paula | $42,655 |
Source: Public Records
Tax History
| Year | Tax Paid | Tax Assessment Tax Assessment Total Assessment is a certain percentage of the fair market value that is determined by local assessors to be the total taxable value of land and additions on the property. | Land | Improvement |
|---|---|---|---|---|
| 2024 | $955 | $18,760 | $3,570 | $15,190 |
| 2023 | $790 | $18,760 | $3,570 | $15,190 |
| 2022 | $708 | $13,620 | $3,260 | $10,360 |
| 2021 | $710 | $13,620 | $3,260 | $10,360 |
| 2020 | $712 | $13,620 | $3,260 | $10,360 |
| 2019 | $686 | $12,010 | $3,010 | $9,000 |
| 2018 | $668 | $12,010 | $3,010 | $9,000 |
| 2017 | $666 | $12,010 | $3,010 | $9,000 |
| 2016 | $671 | $11,870 | $3,010 | $8,860 |
| 2015 | $619 | $11,870 | $3,010 | $8,860 |
| 2014 | $618 | $11,870 | $3,010 | $8,860 |
| 2013 | $652 | $12,430 | $3,010 | $9,420 |
Source: Public Records
Map
Nearby Homes
- 5239 Cadwallader Sonk Rd
- 4875 Cadwallader-Sonk Rd
- 2486 Waynewood Dr NE
- 4274 Cadwallader-Sonk Rd
- 3740 Wilson Sharpsville Rd
- 2009 Sodom Hutchings Rd NE
- 5013 King-Graves Rd
- 3572 Wilson Sharpsville Rd
- 305 Ridge Rd
- 6739 Wilson Sharpsville Rd
- 1555 Sodom Hutchings Rd NE
- 1440 Youngstown Kingsville Rd
- 4136 State Route 7
- 3098 Fowler St
- 232 Bayview Dr Unit 232
- 465 S Colonial Dr
- 0 Warner Rd
- 0 St Andrews Unit 5113795
- 0 Saint Andrews
- 324 Greenbriar Dr
- 5113 Wilson Sharpsville Rd
- 5129 State Route 305
- 5129 Wilson Sharpsville Rd
- 2 Sodom Hutchings Rd
- 3395 Sodom Hutchings Rd
- 5157 State Route 305
- 5058 State Route 305
- 5057 State Route 305
- 5050 State Route 305
- 5053 State Route 305
- 5049 State Route 305
- 5037 State Route 305
- 5037 Wilson Sharpsville Rd Unit 4
- 5037 Wilson Sharpsville Rd Unit 1
- 5037 Wilson Sharpsville Rd Unit 5
- 5037 Wilson Sharpsville Rd Unit 2
- 5037 State Route 305 Unit 5
- 5037 Wilson Sharpsville Rd
- 5037 St Rt 305 (Wilson Sharpvville)
- 5032 State Route 305
Your Personal Tour Guide
Ask me questions while you tour the home.