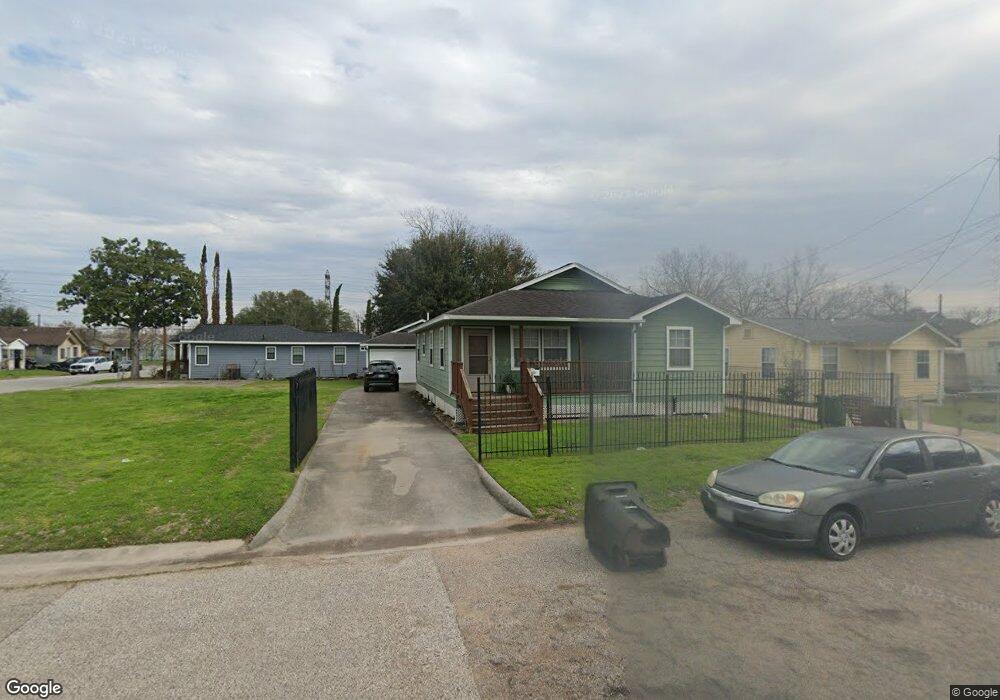
5114 Terry St Houston, TX 77009
Ryon NeighborhoodEstimated Value: $273,000 - $320,000
2
Beds
1
Bath
1,195
Sq Ft
$248/Sq Ft
Est. Value
About This Home
This home is located at 5114 Terry St, Houston, TX 77009 and is currently estimated at $296,669, approximately $248 per square foot. 5114 Terry St is a home located in Harris County with nearby schools including Jefferson Elementary School, Marshall Middle, and Northside High School.
Ownership History
Date
Name
Owned For
Owner Type
Purchase Details
Closed on
Jun 22, 2001
Sold by
New Hope Baptist Church
Bought by
Smith Mary Louise and Smith Herman Eugene
Current Estimated Value
Purchase Details
Closed on
Feb 11, 1999
Sold by
Sarkar Subhendra N and Raha Madhuchanda
Bought by
Popham Ellen G and Spratt Karen
Home Financials for this Owner
Home Financials are based on the most recent Mortgage that was taken out on this home.
Original Mortgage
$72,393
Interest Rate
6.85%
Mortgage Type
FHA
Create a Home Valuation Report for This Property
The Home Valuation Report is an in-depth analysis detailing your home's value as well as a comparison with similar homes in the area
Home Values in the Area
Average Home Value in this Area
Purchase History
| Date | Buyer | Sale Price | Title Company |
|---|---|---|---|
| Smith Mary Louise | -- | -- | |
| Popham Ellen G | -- | Chicago Title |
Source: Public Records
Mortgage History
| Date | Status | Borrower | Loan Amount |
|---|---|---|---|
| Previous Owner | Popham Ellen G | $72,393 |
Source: Public Records
Tax History Compared to Growth
Tax History
| Year | Tax Paid | Tax Assessment Tax Assessment Total Assessment is a certain percentage of the fair market value that is determined by local assessors to be the total taxable value of land and additions on the property. | Land | Improvement |
|---|---|---|---|---|
| 2025 | $5,231 | $250,000 | $150,000 | $100,000 |
| 2024 | $5,231 | $250,000 | $150,000 | $100,000 |
| 2023 | $5,231 | $246,420 | $125,000 | $121,420 |
| 2022 | $5,390 | $244,773 | $125,000 | $119,773 |
| 2021 | $4,442 | $190,569 | $85,000 | $105,569 |
| 2020 | $4,763 | $196,688 | $85,000 | $111,688 |
| 2019 | $4,977 | $196,688 | $85,000 | $111,688 |
| 2018 | $4,072 | $160,939 | $60,000 | $100,939 |
| 2017 | $3,775 | $149,292 | $50,000 | $99,292 |
| 2016 | $3,571 | $141,212 | $45,000 | $96,212 |
| 2015 | $438 | $120,937 | $27,500 | $93,437 |
| 2014 | $438 | $88,235 | $22,500 | $65,735 |
Source: Public Records
Map
Nearby Homes