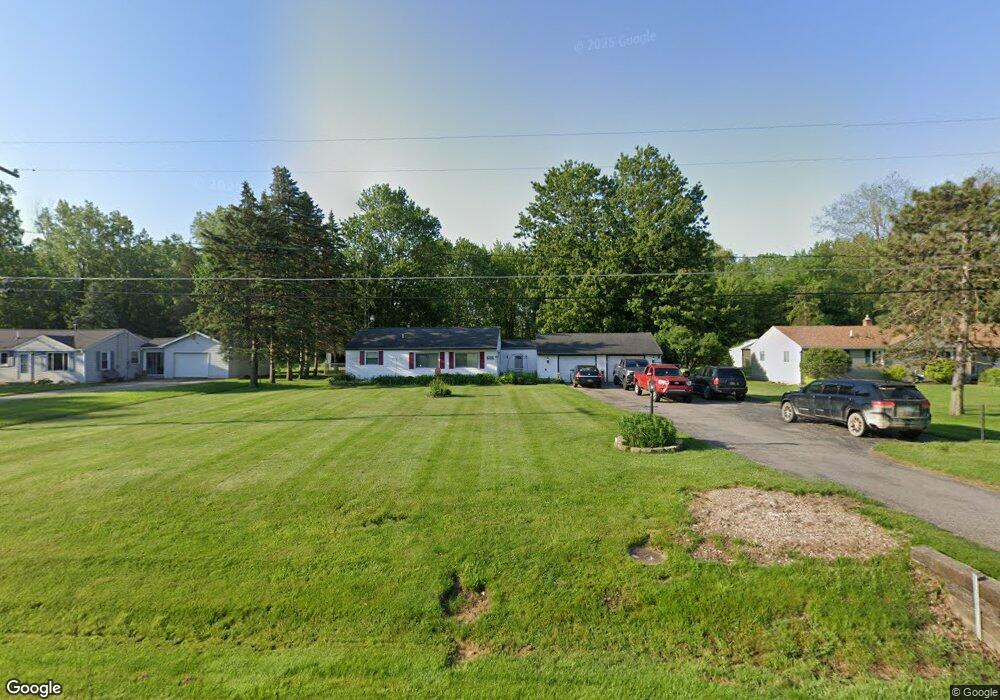
5116 E Frances Rd Mount Morris, MI 48458
Estimated Value: $167,000 - $198,000
Studio
1
Bath
1,344
Sq Ft
$132/Sq Ft
Est. Value
About This Home
This home is located at 5116 E Frances Rd, Mount Morris, MI 48458 and is currently estimated at $177,220, approximately $131 per square foot. 5116 E Frances Rd is a home located in Genesee County.
Ownership History
Date
Name
Owned For
Owner Type
Purchase Details
Closed on
May 19, 2021
Sold by
Fremd Donald K and Durecki Diane M
Bought by
Fremd Donald K and Fremd Diane M
Current Estimated Value
Home Financials for this Owner
Home Financials are based on the most recent Mortgage that was taken out on this home.
Original Mortgage
$98,000
Outstanding Balance
$73,915
Interest Rate
2.9%
Mortgage Type
New Conventional
Estimated Equity
$103,305
Purchase Details
Closed on
Aug 29, 2002
Sold by
Dehmel Douglas D
Bought by
Fremd Donald K and Durecki Diane M
Purchase Details
Closed on
Mar 2, 2001
Sold by
Federal National Mortgage Association
Bought by
Dehmel Douglas D
Home Financials for this Owner
Home Financials are based on the most recent Mortgage that was taken out on this home.
Original Mortgage
$75,300
Interest Rate
7.13%
Purchase Details
Closed on
Oct 29, 2000
Sold by
Amerihome Mtg Corp
Bought by
The Federal National Mtg Assn
Purchase Details
Closed on
Sep 28, 2000
Sold by
Sikora Phyllis E
Bought by
Amerihome Mtg Corp
Create a Home Valuation Report for This Property
The Home Valuation Report is an in-depth analysis detailing your home's value as well as a comparison with similar homes in the area
Home Values in the Area
Average Home Value in this Area
Purchase History
| Date | Buyer | Sale Price | Title Company |
|---|---|---|---|
| Fremd Donald K | -- | Avenue 365 Lender Services L | |
| Fremd Donald K | $90,000 | Guaranty Title Company | |
| Dehmel Douglas D | -- | Centennial Title Co | |
| The Federal National Mtg Assn | -- | Guaranty Title Company | |
| Amerihome Mtg Corp | $46,507 | -- |
Source: Public Records
Mortgage History
| Date | Status | Borrower | Loan Amount |
|---|---|---|---|
| Open | Fremd Donald K | $98,000 | |
| Previous Owner | Dehmel Douglas D | $75,300 |
Source: Public Records
Tax History
| Year | Tax Paid | Tax Assessment Tax Assessment Total Assessment is a certain percentage of the fair market value that is determined by local assessors to be the total taxable value of land and additions on the property. | Land | Improvement |
|---|---|---|---|---|
| 2025 | $2,294 | $86,900 | $0 | $0 |
| 2024 | $505 | $80,400 | $0 | $0 |
| 2023 | $482 | $71,500 | $0 | $0 |
| 2022 | $1,959 | $63,700 | $0 | $0 |
| 2021 | $1,946 | $56,600 | $0 | $0 |
| 2020 | $441 | $52,500 | $0 | $0 |
| 2019 | $433 | $46,900 | $0 | $0 |
| 2018 | $1,922 | $43,900 | $0 | $0 |
| 2017 | $1,871 | $43,600 | $0 | $0 |
| 2016 | $1,854 | $41,000 | $0 | $0 |
| 2015 | $1,576 | $37,800 | $0 | $0 |
| 2014 | $400 | $36,200 | $0 | $0 |
| 2012 | -- | $33,400 | $33,400 | $0 |
Source: Public Records
Map
Nearby Homes
- 8315 Camelot Ct Unit 23
- 0 E Frances Rd Unit 20251026824
- 4251 E Frances Rd
- 4181 E Mt Morris Rd
- 8247 N Center Rd
- 6393 E Frances Rd
- 6465 E Frances Rd
- 8405 N Vassar Rd
- 7152 Russell St
- 0 N Genesee Rd Unit 50142777
- 7258 N Center Rd
- 7126 Birchwood Dr
- 7174 N Center Rd
- 7047 Birchwood Dr
- 6478 Oxbow Ln
- 5412 E Stanley Rd
- 7368 Vassar Rd
- 3399 E Stanley Rd
- 4442 E Wilson Rd
- 6274 Cree Ct
- 5104 E Frances Rd
- 5124 E Frances Rd
- 5094 E Frances Rd
- 5134 E Frances Rd
- 5146 E Frances Rd
- 5082 E Frances Rd
- 5156 E Frances Rd
- 5074 E Frances Rd
- 5066 E Frances Rd
- 5166 E Frances Rd
- 5050 E Frances Rd
- 5069 E Frances Rd
- 8500 N Genesee Rd
- 5188 E Frances Rd
- 8496 N Genesee Rd
- 5059 E Frances Rd
- 5049 E Frances Rd
- 5036 E Frances Rd
- 5204 E Frances Rd
- 8510 N Genesee Rd Unit Bldg-Unit
Your Personal Tour Guide
Ask me questions while you tour the home.