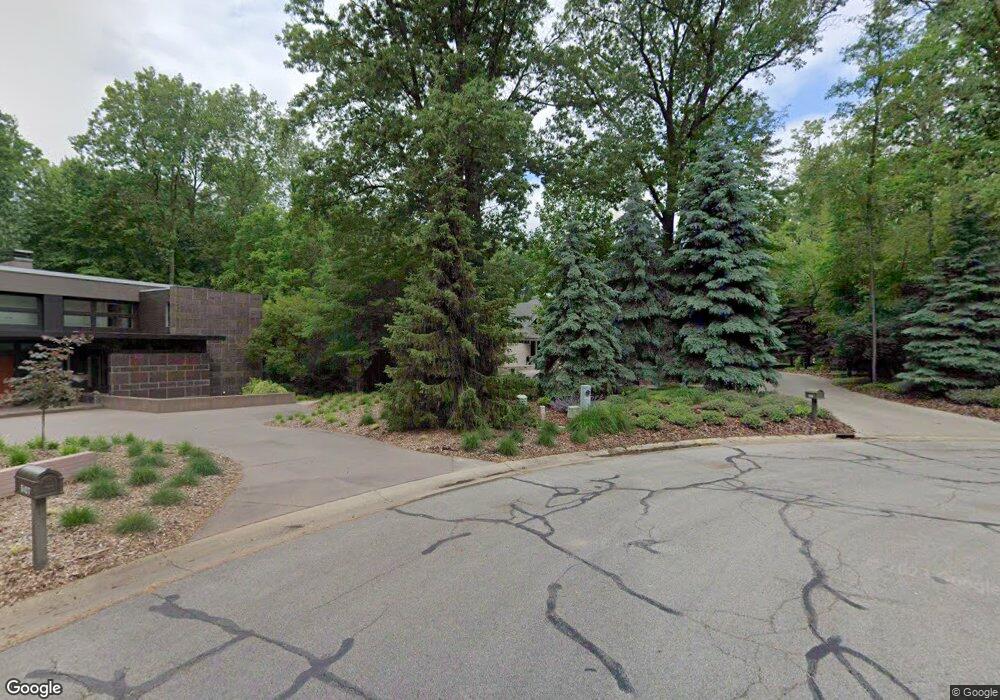
5116 Highpoint Dr Toledo, OH 43615
Estimated Value: $673,000 - $1,271,833
4
Beds
6
Baths
3,226
Sq Ft
$309/Sq Ft
Est. Value
About This Home
This home is located at 5116 Highpoint Dr, Toledo, OH 43615 and is currently estimated at $997,611, approximately $309 per square foot. 5116 Highpoint Dr is a home located in Lucas County with nearby schools including Whiteford Elementary School, Sylvania Arbor Hills Junior High School, and Sylvania Southview High School.
Ownership History
Date
Name
Owned For
Owner Type
Purchase Details
Closed on
May 20, 2010
Sold by
Shugarman Shirley C
Bought by
Area Title Agency Inc
Current Estimated Value
Home Financials for this Owner
Home Financials are based on the most recent Mortgage that was taken out on this home.
Original Mortgage
$194,000
Interest Rate
5.3%
Mortgage Type
New Conventional
Purchase Details
Closed on
Jul 9, 2008
Sold by
Osnowitz Samuel
Bought by
Shugarman Shirley C
Purchase Details
Closed on
Dec 23, 2005
Sold by
Nichols Joan L and Nichols R
Bought by
Osnowitz Samuel
Purchase Details
Closed on
Aug 12, 1998
Sold by
Mcgowan Wildewood Ltd
Bought by
Nichols R Hel and Nichols Joan
Create a Home Valuation Report for This Property
The Home Valuation Report is an in-depth analysis detailing your home's value as well as a comparison with similar homes in the area
Home Values in the Area
Average Home Value in this Area
Purchase History
| Date | Buyer | Sale Price | Title Company |
|---|---|---|---|
| Area Title Agency Inc | $299,000 | Attorney | |
| Shugarman Shirley C | -- | Attorney | |
| Osnowitz Samuel | $335,000 | None Available | |
| Nichols R Hel | $395,000 | Louisville Title Agency For |
Source: Public Records
Mortgage History
| Date | Status | Borrower | Loan Amount |
|---|---|---|---|
| Closed | Area Title Agency Inc | $194,000 |
Source: Public Records
Tax History Compared to Growth
Tax History
| Year | Tax Paid | Tax Assessment Tax Assessment Total Assessment is a certain percentage of the fair market value that is determined by local assessors to be the total taxable value of land and additions on the property. | Land | Improvement |
|---|---|---|---|---|
| 2024 | $12,209 | $374,080 | $50,400 | $323,680 |
| 2023 | $22,293 | $292,425 | $34,090 | $258,335 |
| 2022 | $22,319 | $292,425 | $34,090 | $258,335 |
| 2021 | $22,867 | $292,425 | $34,090 | $258,335 |
| 2020 | $24,685 | $279,615 | $32,585 | $247,030 |
| 2019 | $23,797 | $279,615 | $32,585 | $247,030 |
| 2018 | $22,990 | $279,615 | $32,585 | $247,030 |
| 2017 | $25,033 | $267,855 | $31,640 | $236,215 |
| 2016 | $24,562 | $765,300 | $90,400 | $674,900 |
| 2015 | $22,223 | $733,200 | $90,400 | $642,800 |
| 2014 | $25,104 | $193,590 | $30,420 | $163,170 |
| 2013 | $16,736 | $193,590 | $30,420 | $163,170 |
Source: Public Records
Map
Nearby Homes
- 3555 Hill River Dr
- 4921 Pine Ridge Rd
- 4905 Pine Ridge Rd
- 4906 Pine Ridge Rd
- 3450 Shakespeare Ln
- 2949 Secretariat Rd
- 4226 Corey Rd
- 4533 Satinwood Ct
- 5036 Valencia Dr
- 3131 Van Fleet Pkwy
- 230 Southbridge Rd
- 3309 Waldmar Rd
- 4545 Indian Rd
- 2720 Derby Rd
- 5021 Rudgate Blvd
- 3207 Waldmar Rd
- 5212 Regency Dr
- 4550 Vineyard Rd
- 4259 Rose Garden Dr
- 4557 Sadalia Rd
- 5106 Highpoint Dr
- 5107 Highpoint Dr
- 5065 Highpoint Dr
- 5070 Highpoint Dr
- 5055 Highpoint Dr
- 5060 Highpoint Dr
- 3727 Shah Place
- 5030 Highpoint Dr
- 5045 Highpoint Dr
- 5020 Highpoint Dr
- 5035 Highpoint Dr
- 5115 Chatham Valley
- 5107 Chatham Valley
- 5025 Highpoint Dr
- 5010 Highpoint Dr
- 5005 Highpoint Dr
- 3515 Hill River Dr
- 3523 Hill River Dr
- 5000 Highpoint Dr
- 5057 Hingham Ln