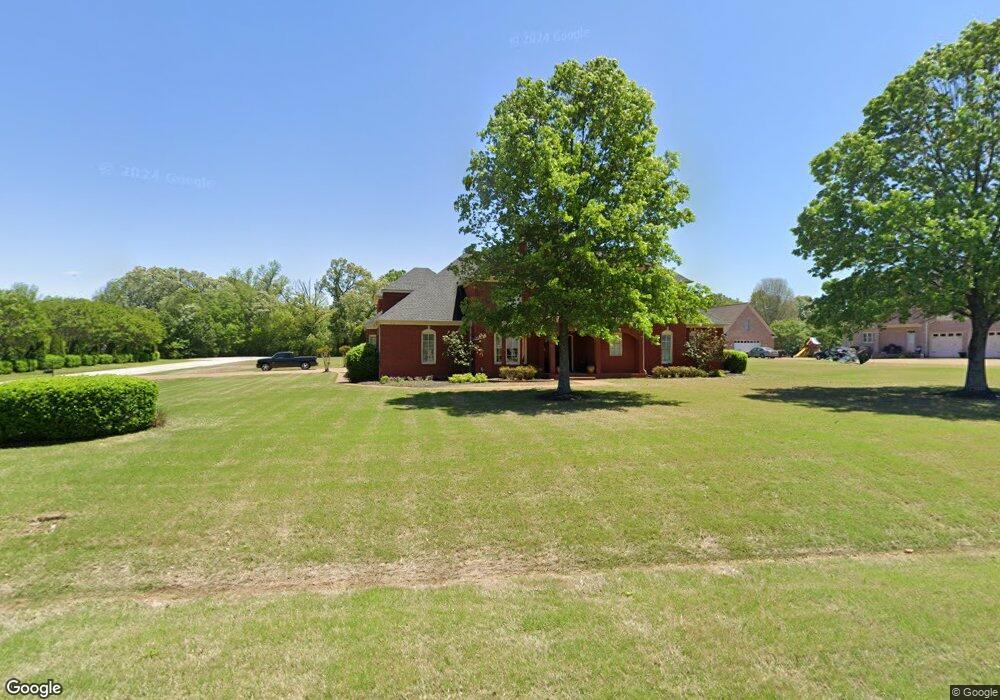
5116 Rowen Oak Rd Collierville, TN 38017
Estimated Value: $867,000 - $962,616
5
Beds
7
Baths
5,911
Sq Ft
$156/Sq Ft
Est. Value
About This Home
This home is located at 5116 Rowen Oak Rd, Collierville, TN 38017 and is currently estimated at $923,904, approximately $156 per square foot. 5116 Rowen Oak Rd is a home located in Shelby County with nearby schools including Schilling Farms Elementary School, West Collierville Middle School, and Collierville High School.
Ownership History
Date
Name
Owned For
Owner Type
Purchase Details
Closed on
Aug 29, 2006
Sold by
Nichols Harry L
Bought by
Shaw Reginald B and Shaw Belinda P
Current Estimated Value
Home Financials for this Owner
Home Financials are based on the most recent Mortgage that was taken out on this home.
Original Mortgage
$500,000
Outstanding Balance
$298,147
Interest Rate
6.73%
Mortgage Type
Unknown
Estimated Equity
$625,757
Purchase Details
Closed on
Aug 31, 2004
Sold by
Ragland Thelma L
Bought by
Nichols Harry L
Home Financials for this Owner
Home Financials are based on the most recent Mortgage that was taken out on this home.
Original Mortgage
$563,424
Interest Rate
5.5%
Mortgage Type
Unknown
Purchase Details
Closed on
Jan 23, 2001
Sold by
Ragland Thelma L
Bought by
Ragland Thelma L and The Thelma Ragland Trust
Purchase Details
Closed on
Sep 27, 1996
Sold by
Porter Development Company Inc
Bought by
Ragland Thelma L
Create a Home Valuation Report for This Property
The Home Valuation Report is an in-depth analysis detailing your home's value as well as a comparison with similar homes in the area
Home Values in the Area
Average Home Value in this Area
Purchase History
| Date | Buyer | Sale Price | Title Company |
|---|---|---|---|
| Shaw Reginald B | $625,000 | Realty Title & Escrow Co Inc | |
| Nichols Harry L | $110,000 | Fidelity Title & Escrow Inc | |
| Ragland Thelma L | -- | -- | |
| Ragland Thelma L | -- | -- | |
| Ragland Thelma L | $78,000 | Security Title Company Inc | |
| Ragland Thelma L | $78,000 | Security Title Company Inc |
Source: Public Records
Mortgage History
| Date | Status | Borrower | Loan Amount |
|---|---|---|---|
| Open | Shaw Reginald B | $500,000 | |
| Previous Owner | Nichols Harry L | $563,424 |
Source: Public Records
Tax History Compared to Growth
Tax History
| Year | Tax Paid | Tax Assessment Tax Assessment Total Assessment is a certain percentage of the fair market value that is determined by local assessors to be the total taxable value of land and additions on the property. | Land | Improvement |
|---|---|---|---|---|
| 2025 | $5,252 | $234,425 | $35,500 | $198,925 |
| 2024 | $5,252 | $154,925 | $27,450 | $127,475 |
| 2023 | $8,103 | $154,925 | $27,450 | $127,475 |
| 2022 | $7,917 | $154,925 | $27,450 | $127,475 |
| 2021 | $8,010 | $154,925 | $27,450 | $127,475 |
| 2020 | $7,315 | $124,400 | $27,450 | $96,950 |
| 2019 | $5,038 | $124,400 | $27,450 | $96,950 |
| 2018 | $5,038 | $124,400 | $27,450 | $96,950 |
| 2017 | $5,113 | $124,400 | $27,450 | $96,950 |
| 2016 | $5,008 | $114,600 | $0 | $0 |
| 2014 | $5,008 | $114,600 | $0 | $0 |
Source: Public Records
Map
Nearby Homes
- 11957 E Holmes Rd
- 10489 Fireweek Ln
- 4849 Zander Ln
- 4845 Zander Ln
- 10412 Pilot Rock Rd
- 4844 Lyla Ln
- 10217 Louanne Dr
- Monroe Plan at Lockwood
- Ashmont Plan at Lockwood
- Townsend Plan at Lockwood
- Chelsea Plan at Lockwood
- Worthington Plan at Lockwood
- Glenmore Plan at Lockwood
- Asher Plan at Lockwood
- Arbor Plan at Lockwood
- Manning Plan at Lockwood
- Anniston Plan at Lockwood
- Harper Plan at Lockwood
- Huntley Plan at Lockwood
- Amelia Plan at Lockwood
- 5126 Rowen Oak Rd
- 5080 Rowen Oak Rd
- 5093 Rowen Oak Rd
- 5113 Rowen Oak Rd
- 5146 Rowen Oak Rd
- 5131 Rowen Oak Rd
- 5060 Rowen Oak Rd
- 5075 Rowen Oak Rd
- 5149 Rowen Oak Rd
- 5057 Rowen Oak Rd
- 5166 Rowen Oak Rd
- 5169 Rowen Oak Rd
- 5040 Rowen Oak Rd
- 5191 Rowen Oak Rd
- 5190 Rowen Oak Rd
- 10251 Springmont Trail
- 5020 Rowen Oak Rd
- 5015 Rowen Oak Cove
- 5015 Rowen Oak Rd
- 5004 Rowen Oak Rd