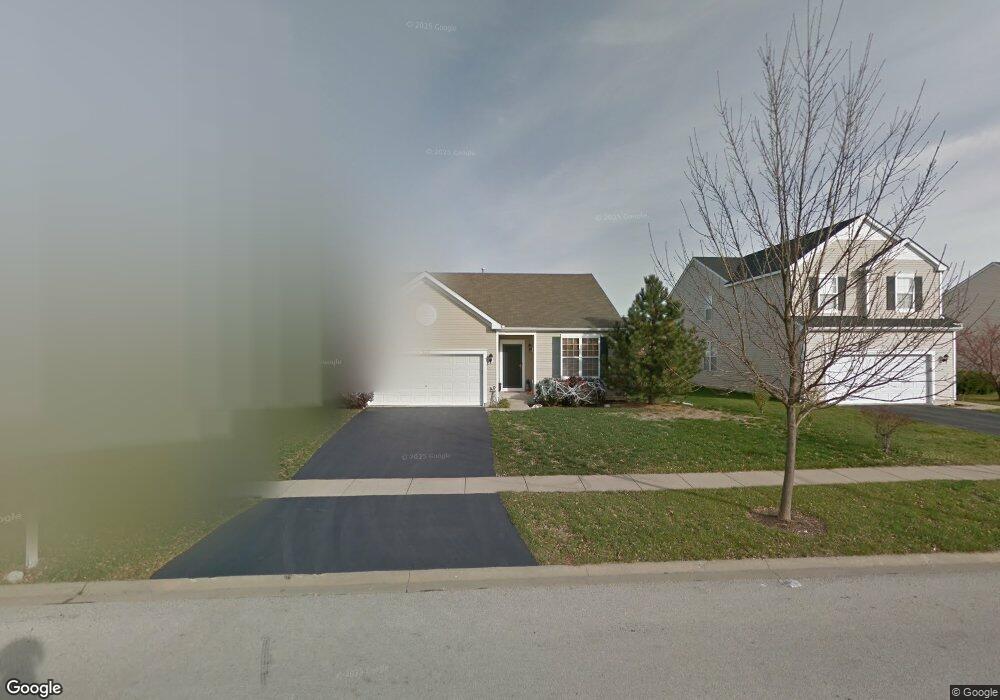
5117 Gardiner Glenn Dr Plainfield, IL 60586
Fall Creek NeighborhoodEstimated Value: $318,880 - $362,000
2
Beds
2
Baths
1,417
Sq Ft
$237/Sq Ft
Est. Value
About This Home
This home is located at 5117 Gardiner Glenn Dr, Plainfield, IL 60586 and is currently estimated at $335,720, approximately $236 per square foot. 5117 Gardiner Glenn Dr is a home located in Will County with nearby schools including Hofer Elementary School, Troy Middle School, and Orenic Intermediate School.
Ownership History
Date
Name
Owned For
Owner Type
Purchase Details
Closed on
Jun 7, 2018
Sold by
Scioto Properties Sp 16 Llc
Bought by
Sbf 1 Properties Llc
Current Estimated Value
Purchase Details
Closed on
Sep 15, 2017
Sold by
Potter David
Bought by
Scioto Properties Sp-16 Llc
Purchase Details
Closed on
May 25, 2006
Sold by
Schmidt Kurt J
Bought by
Potter David
Home Financials for this Owner
Home Financials are based on the most recent Mortgage that was taken out on this home.
Original Mortgage
$184,000
Interest Rate
6.62%
Mortgage Type
Fannie Mae Freddie Mac
Purchase Details
Closed on
Apr 1, 2006
Sold by
Centex Homes
Bought by
Schmidt Kurt J
Home Financials for this Owner
Home Financials are based on the most recent Mortgage that was taken out on this home.
Original Mortgage
$184,000
Interest Rate
6.62%
Mortgage Type
Fannie Mae Freddie Mac
Create a Home Valuation Report for This Property
The Home Valuation Report is an in-depth analysis detailing your home's value as well as a comparison with similar homes in the area
Home Values in the Area
Average Home Value in this Area
Purchase History
| Date | Buyer | Sale Price | Title Company |
|---|---|---|---|
| Sbf 1 Properties Llc | -- | Attorney | |
| Scioto Properties Sp-16 Llc | $205,000 | Security First Title Co | |
| Potter David | $230,000 | First American Title | |
| Schmidt Kurt J | $204,500 | None Available |
Source: Public Records
Mortgage History
| Date | Status | Borrower | Loan Amount |
|---|---|---|---|
| Previous Owner | Potter David | $184,000 | |
| Previous Owner | Schmidt Kurt J | $163,256 |
Source: Public Records
Tax History
| Year | Tax Paid | Tax Assessment Tax Assessment Total Assessment is a certain percentage of the fair market value that is determined by local assessors to be the total taxable value of land and additions on the property. | Land | Improvement |
|---|---|---|---|---|
| 2024 | $8,621 | $98,194 | $16,619 | $81,575 |
| 2023 | $8,621 | $85,576 | $14,932 | $70,644 |
| 2022 | $7,470 | $80,478 | $14,129 | $66,349 |
| 2021 | $7,035 | $75,709 | $13,292 | $62,417 |
| 2020 | $6,489 | $69,743 | $13,292 | $56,451 |
| 2019 | $6,315 | $66,900 | $12,750 | $54,150 |
| 2018 | $6,128 | $63,000 | $12,750 | $50,250 |
| 2017 | $5,316 | $59,600 | $12,750 | $46,850 |
| 2016 | $5,168 | $56,250 | $12,750 | $43,500 |
| 2015 | $4,644 | $52,598 | $11,448 | $41,150 |
| 2014 | $4,644 | $49,948 | $11,448 | $38,500 |
| 2013 | $4,644 | $52,726 | $11,448 | $41,278 |
Source: Public Records
Map
Nearby Homes
- 1409 Bridgehampton Dr
- 5012 Norwalk Ct Unit 2
- 5113 Wildflower Ct
- 1424 Westhampton Dr Unit 1424
- 1303 Bridgehampton Dr Unit 2
- 1700 Chestnut Hill Rd
- 5300 Lindenwood Cir
- 1504 Lasser Dr
- 5210 Pine Trails Cir
- 1814 Larkspur Dr
- 1852 Maple Glen Dr
- 818 Vertin Blvd
- 1149 Baccarrat Ct
- 1146 Baccarrat Ct
- 2004 Kingsbury Estates Dr
- 4757 Foster Ct Unit 3
- 2010 Primrose Dr
- 2019 Gleneagle Dr
- 7611 Sassafras Ln
- 1114 Kylemore Ct
- 5115 Gardiner Glenn Dr
- 5201 Gardiner Glenn Dr
- 5116 Woodmere Ct Unit 1
- 5113 Gardiner Glenn Dr
- 5203 Gardiner Glenn Dr
- 5114 Woodmere Ct
- 1505 Broadlawn Dr
- 5118 Woodmere Ct Unit 1
- 5112 Woodmere Ct
- 5111 Gardiner Glenn Dr
- 1504 Bridgehampton Dr Unit 2
- 5205 Gardiner Glenn Dr
- 5110 Woodmere Ct
- 1503 Broadlawn Dr
- 1504 Broadlawn Dr
- 1502 Bridgehampton Dr Unit 2
- 5109 Gardiner Glenn Dr
- 5119 Woodmere Ct
- 5108 Woodmere Ct Unit 1
- 1507 Bridgehampton Dr Unit 2
Your Personal Tour Guide
Ask me questions while you tour the home.