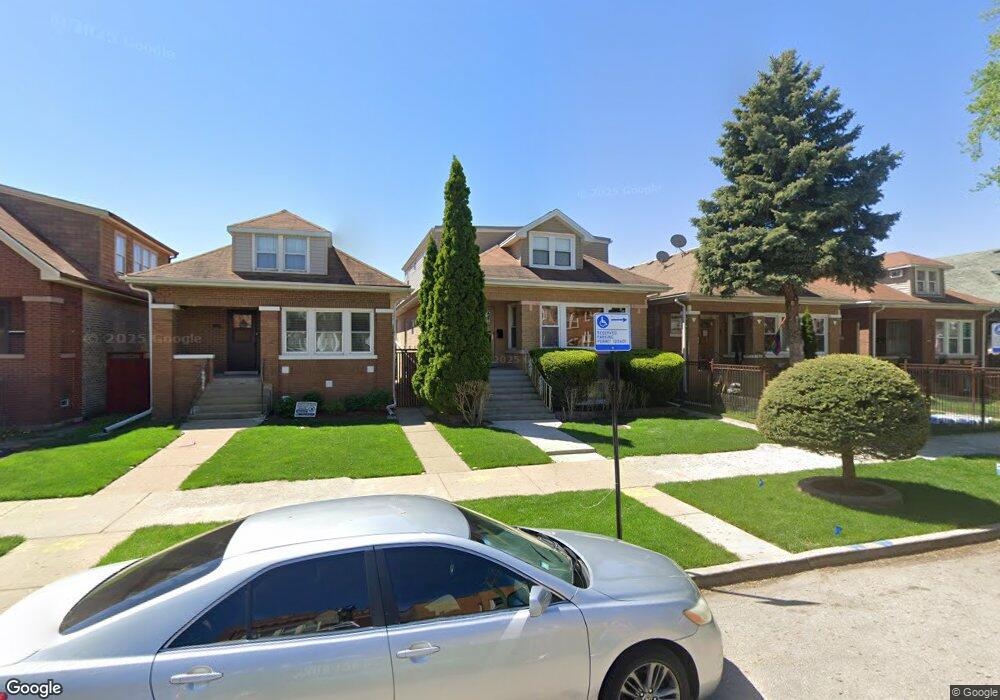
5117 W Wellington Ave Chicago, IL 60641
Cragin NeighborhoodEstimated Value: $392,000 - $526,000
4
Beds
3
Baths
2,189
Sq Ft
$205/Sq Ft
Est. Value
About This Home
This home is located at 5117 W Wellington Ave, Chicago, IL 60641 and is currently estimated at $447,973, approximately $204 per square foot. 5117 W Wellington Ave is a home located in Cook County with nearby schools including Falconer Elementary School, Foreman College and Career Academy, and Kelvyn Park High School.
Ownership History
Date
Name
Owned For
Owner Type
Purchase Details
Closed on
Jul 31, 2002
Sold by
Flores Pedro and Maldonado Elvia
Bought by
Deoca Arturo Montes
Current Estimated Value
Home Financials for this Owner
Home Financials are based on the most recent Mortgage that was taken out on this home.
Original Mortgage
$197,500
Outstanding Balance
$83,990
Interest Rate
6.62%
Estimated Equity
$363,983
Purchase Details
Closed on
Nov 9, 1998
Sold by
Flores Alfonso and Maldonado Elvia
Bought by
Flores Pedro and Maldonado Elvia
Home Financials for this Owner
Home Financials are based on the most recent Mortgage that was taken out on this home.
Original Mortgage
$152,900
Interest Rate
7.01%
Purchase Details
Closed on
Dec 5, 1995
Sold by
Velixaru Stefan and Velixaru Georgeta
Bought by
Flores Pedro and Maldonado Elvia
Home Financials for this Owner
Home Financials are based on the most recent Mortgage that was taken out on this home.
Original Mortgage
$147,086
Interest Rate
7.45%
Mortgage Type
FHA
Create a Home Valuation Report for This Property
The Home Valuation Report is an in-depth analysis detailing your home's value as well as a comparison with similar homes in the area
Home Values in the Area
Average Home Value in this Area
Purchase History
| Date | Buyer | Sale Price | Title Company |
|---|---|---|---|
| Deoca Arturo Montes | $225,000 | Heritage Title Co | |
| Flores Pedro | -- | -- | |
| Flores Pedro | $149,000 | -- |
Source: Public Records
Mortgage History
| Date | Status | Borrower | Loan Amount |
|---|---|---|---|
| Open | Deoca Arturo Montes | $197,500 | |
| Previous Owner | Flores Pedro | $152,900 | |
| Previous Owner | Flores Pedro | $147,086 |
Source: Public Records
Tax History Compared to Growth
Tax History
| Year | Tax Paid | Tax Assessment Tax Assessment Total Assessment is a certain percentage of the fair market value that is determined by local assessors to be the total taxable value of land and additions on the property. | Land | Improvement |
|---|---|---|---|---|
| 2024 | $4,521 | $37,563 | $6,938 | $30,625 |
| 2023 | $4,381 | $25,392 | $5,625 | $19,767 |
| 2022 | $4,381 | $25,392 | $5,625 | $19,767 |
| 2021 | $4,948 | $28,588 | $5,625 | $22,963 |
| 2020 | $5,209 | $27,093 | $4,687 | $22,406 |
| 2019 | $5,292 | $30,442 | $4,687 | $25,755 |
| 2018 | $5,202 | $30,442 | $4,687 | $25,755 |
| 2017 | $5,582 | $29,968 | $4,125 | $25,843 |
| 2016 | $5,362 | $29,968 | $4,125 | $25,843 |
| 2015 | $5,254 | $31,278 | $4,125 | $27,153 |
| 2014 | $3,270 | $20,180 | $3,750 | $16,430 |
| 2013 | $3,194 | $20,180 | $3,750 | $16,430 |
Source: Public Records
Map
Nearby Homes
- 3043 N Laramie Ave Unit 2
- 3045 N Laramie Ave Unit 2
- 5042 W Wellington Ave
- 5038 W Nelson St
- 5243 W Oakdale Ave
- 5021 W Nelson St
- 5244 W Barry Ave
- 5041 W Fletcher St
- 5254 W Wolfram St
- 5303 W George St
- 5121 W Diversey Ave Unit 3N
- 5121 W Diversey Ave Unit 3S
- 4918-22 W Diversey Ave
- 5335 W Barry Ave
- 4950 W Diversey Ave
- 5233 W Parker Ave
- 3036 N Long Ave
- 2939 N Lotus Ave
- 4825 W George St
- 5205 W Drummond Place Unit 1
- 5113 W Wellington Ave
- 5119 W Wellington Ave
- 5111 W Wellington Ave
- 5121 W Wellington Ave
- 5107 W Wellington Ave
- 5125 W Wellington Ave
- 5129 W Wellington Ave
- 5105 W Wellington Ave
- 5114 W Oakdale Ave
- 5118 W Oakdale Ave
- 5112 W Oakdale Ave
- 5131 W Wellington Ave
- 5101 W Wellington Ave
- 5124 W Oakdale Ave
- 5106 W Oakdale Ave
- 5122 W Oakdale Ave
- 5110 W Oakdale Ave
- 5135 W Wellington Ave Unit 2
- 5128 W Oakdale Ave
- 5102 W Oakdale Ave