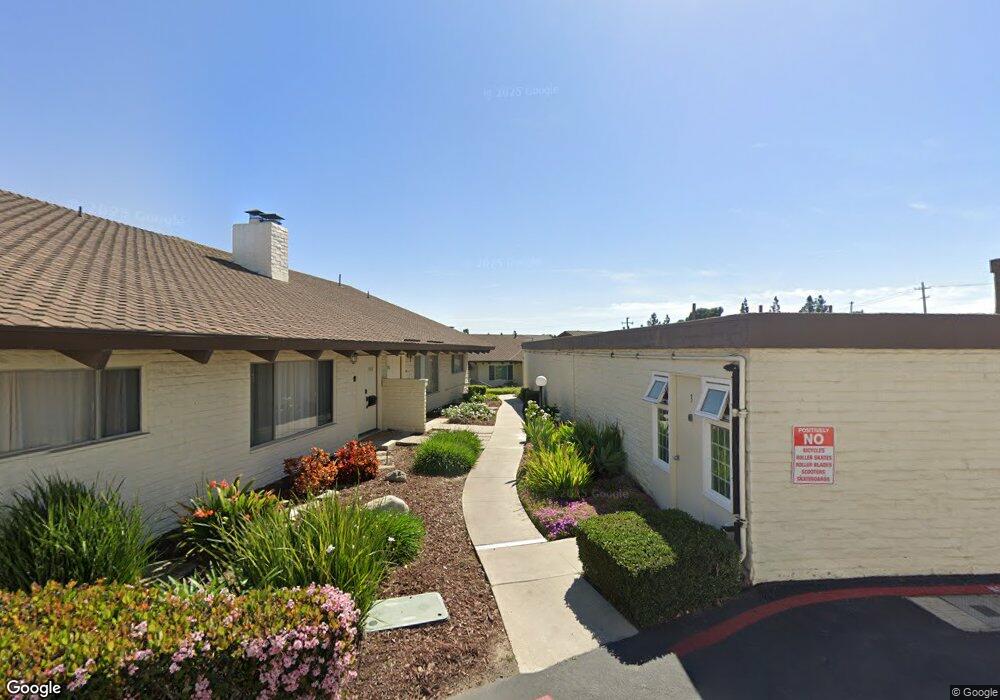
5118 Lakeview Ave Unit 4 Yorba Linda, CA 92886
Estimated Value: $614,000 - $776,000
2
Beds
2
Baths
1,125
Sq Ft
$603/Sq Ft
Est. Value
About This Home
This home is located at 5118 Lakeview Ave Unit 4, Yorba Linda, CA 92886 and is currently estimated at $678,642, approximately $603 per square foot. 5118 Lakeview Ave Unit 4 is a home located in Orange County with nearby schools including Linda Vista Elementary School, Yorba Linda Middle School, and Friends Christian School.
Ownership History
Date
Name
Owned For
Owner Type
Purchase Details
Closed on
Mar 12, 2025
Sold by
Estes Rochelle Denise and Dismuke Andrew Russell
Bought by
Estes Rochelle Denise and Dismuke Andrew Russell
Current Estimated Value
Home Financials for this Owner
Home Financials are based on the most recent Mortgage that was taken out on this home.
Original Mortgage
$487,500
Outstanding Balance
$484,995
Interest Rate
6.85%
Mortgage Type
New Conventional
Estimated Equity
$193,647
Purchase Details
Closed on
Dec 31, 2018
Sold by
Estes Rochell Denise
Bought by
Estes Rochell Denise and Dismuke Andrew Russell
Purchase Details
Closed on
Oct 9, 2006
Sold by
Kiger Diane M and Hiskey David D
Bought by
Estes Rochell Denise
Home Financials for this Owner
Home Financials are based on the most recent Mortgage that was taken out on this home.
Original Mortgage
$294,400
Interest Rate
6.62%
Mortgage Type
Negative Amortization
Create a Home Valuation Report for This Property
The Home Valuation Report is an in-depth analysis detailing your home's value as well as a comparison with similar homes in the area
Home Values in the Area
Average Home Value in this Area
Purchase History
| Date | Buyer | Sale Price | Title Company |
|---|---|---|---|
| Estes Rochelle Denise | -- | Pacific Coast Title | |
| Estes Rochell Denise | -- | None Available | |
| Estes Rochell Denise | $368,000 | Landamerica Commonwealth Tit |
Source: Public Records
Mortgage History
| Date | Status | Borrower | Loan Amount |
|---|---|---|---|
| Open | Estes Rochelle Denise | $487,500 | |
| Previous Owner | Estes Rochell Denise | $294,400 |
Source: Public Records
Tax History Compared to Growth
Tax History
| Year | Tax Paid | Tax Assessment Tax Assessment Total Assessment is a certain percentage of the fair market value that is determined by local assessors to be the total taxable value of land and additions on the property. | Land | Improvement |
|---|---|---|---|---|
| 2025 | $5,564 | $493,033 | $343,219 | $149,814 |
| 2024 | $5,564 | $483,366 | $336,489 | $146,877 |
| 2023 | $4,987 | $433,846 | $313,831 | $120,015 |
| 2022 | $4,926 | $425,340 | $307,678 | $117,662 |
| 2021 | $4,858 | $417,000 | $301,645 | $115,355 |
| 2020 | $4,914 | $417,000 | $301,645 | $115,355 |
| 2019 | $4,832 | $417,000 | $301,645 | $115,355 |
| 2018 | $4,859 | $417,000 | $301,645 | $115,355 |
| 2017 | $4,194 | $355,000 | $252,823 | $102,177 |
| 2016 | $3,599 | $301,000 | $198,823 | $102,177 |
| 2015 | $3,603 | $301,000 | $198,823 | $102,177 |
| 2014 | $2,862 | $236,175 | $133,998 | $102,177 |
Source: Public Records
Map
Nearby Homes
- 4951 Oak Tree Ct
- 4760 Lakeview Ave
- 4741 School St
- 18083 Burke Ln
- 18571 Buena Vista Ave
- 18066 Lemon Dr
- 4845 Eisenhower Ct
- 4712 Yorba Ln
- 18931 Gordon Ln
- 5231 Highland Ave
- 5245 Grandview Ave
- 5371 Grandview Ave
- 18701 Piper Place
- 17956 Joshua Dr
- 5302 Grandview Ave
- 4642 Ohio St
- 18534 Cobblestone Ct
- 18314 Maidenhair Way
- 18324 Maidenhair Way
- 5729 Grandview Ave
- 5110 Lakeview Ave Unit 3
- 5122 Lakeview Ave Unit 6
- 5108 Lakeview Ave Unit 2
- 5114 Lakeview Ave Unit 15
- 5112 Lakeview Ave Unit 14
- 5106 Lakeview Ave
- 5104 Lakeview Ave
- 5104 Lakeview Ave Unit 13
- 5126 Lakeview Ave
- 5102 Lakeview Ave Unit 12
- 5124 Lakeview Ave Unit 17
- 5048 Lakeview Ave Unit 31
- 5124 Lakeview Ave
- 5116 Lakeview Ave
- 5128 Lakeview Ave Unit 18
- 5130 Lakeview Ave Unit 8
- 5050 Lakeview Ave Unit 32
- 5038 Lakeview Ave
- 5132 Lakeview Ave Unit 19
- 5132 Lakeview Ave