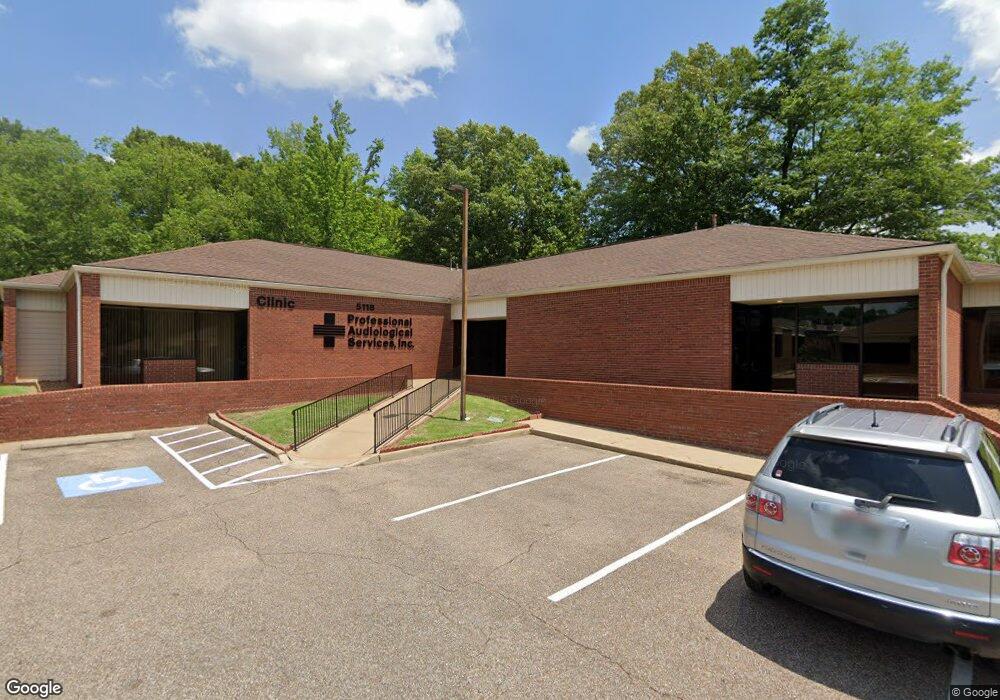
5118 Stage Rd Memphis, TN 38134
Estimated Value: $267,355
--
Bed
--
Bath
5,105
Sq Ft
$52/Sq Ft
Est. Value
About This Home
This home is located at 5118 Stage Rd, Memphis, TN 38134 and is currently estimated at $267,355, approximately $52 per square foot. 5118 Stage Rd is a home located in Shelby County with nearby schools including Brownsville Rd Elementary School, Craigmont Middle School, and Craigmont High School.
Ownership History
Date
Name
Owned For
Owner Type
Purchase Details
Closed on
Mar 31, 2010
Sold by
Wildwood Properties Llc
Bought by
Morton Loretta
Current Estimated Value
Purchase Details
Closed on
Sep 30, 2009
Sold by
Settle Dewun R
Bought by
Wildland Properties Llc
Purchase Details
Closed on
Oct 4, 2007
Sold by
Lincoln Eric
Bought by
Cross James
Purchase Details
Closed on
Jun 9, 2005
Sold by
Cross James
Bought by
Lincoln Eric and Cross James
Purchase Details
Closed on
Feb 8, 2005
Sold by
Greenbelt Development Partners Inc
Bought by
Cross James
Purchase Details
Closed on
Oct 13, 2004
Sold by
Trustmark National Bank
Bought by
Greenbelt Development Partners Inc
Purchase Details
Closed on
Dec 20, 2001
Sold by
Lopez & Omeara Llc
Bought by
Nashoba Bank
Purchase Details
Closed on
Aug 3, 1998
Sold by
Hackmeyer Properties Llc
Bought by
Lopez & Omeara Llc
Create a Home Valuation Report for This Property
The Home Valuation Report is an in-depth analysis detailing your home's value as well as a comparison with similar homes in the area
Home Values in the Area
Average Home Value in this Area
Purchase History
| Date | Buyer | Sale Price | Title Company |
|---|---|---|---|
| Morton Loretta | $115,500 | Saddle Creek Title Llc | |
| Wildland Properties Llc | $53,000 | None Available | |
| Cross James | $100,000 | None Available | |
| Lincoln Eric | -- | -- | |
| Cross James | $100,000 | -- | |
| Greenbelt Development Partners Inc | $190,000 | Memphis Escrow & Title | |
| Nashoba Bank | $185,000 | -- | |
| Lopez & Omeara Llc | $20,000 | -- |
Source: Public Records
Tax History Compared to Growth
Tax History
| Year | Tax Paid | Tax Assessment Tax Assessment Total Assessment is a certain percentage of the fair market value that is determined by local assessors to be the total taxable value of land and additions on the property. | Land | Improvement |
|---|---|---|---|---|
| 2025 | $4,412 | $132,000 | $10,880 | $121,120 |
| 2024 | $4,412 | $130,160 | $10,880 | $119,280 |
| 2023 | $7,929 | $130,160 | $10,880 | $119,280 |
| 2022 | $7,929 | $130,160 | $10,880 | $119,280 |
| 2021 | $8,022 | $130,160 | $10,880 | $119,280 |
| 2020 | $9,188 | $126,800 | $10,880 | $115,920 |
| 2019 | $9,188 | $126,800 | $10,880 | $115,920 |
| 2018 | $9,188 | $126,800 | $10,880 | $115,920 |
| 2017 | $5,211 | $126,800 | $10,880 | $115,920 |
| 2016 | $5,989 | $137,040 | $0 | $0 |
| 2014 | $5,989 | $137,040 | $0 | $0 |
Source: Public Records
Map
Nearby Homes
- 4850 Stage Rd
- 2888 Clearwood Rd
- 2892 Clearwood Rd
- 3064 Wood Thrush Dr
- 2889 Flowerwood Rd
- 5191 Yellowood Rd
- 3213 Covington Pike
- 0 Clearwood Rd
- 2882 Springland St
- 3294 Gatewood Dr
- 3249 Ridge Creek Dr
- 3099 Joslyn St
- 2739 Lynchburg St
- 3219 Wythe Rd
- 5219 Dunnellon Ave
- 3217 Joslyn St
- 3083 Kenneth St
- 3331 Bluemont Dr
- 5366 Craigmont Dr
- 4833 Rolling Meadows Dr
- 5142 Stage Rd
- 5108 Stage Rd Unit G2
- 5108 Stage Rd Unit G1
- 5134 Stage Rd
- 5104 Stage Rd Unit H-1
- 5135 Wood Thrush Cove
- 5146 Stage Rd
- 5154 Stage Rd Unit 101
- 5125 Wood Thrush Cove
- 5145 Wood Thrush Cove
- 5096 Stage Rd Unit A1
- 3025 Wood Thrush Dr
- 3033 Wood Thrush Dr
- 3015 Wood Thrush Dr
- 5155 Wood Thrush Cove
- 5126 Wood Thrush Cove
- 5158 Stage Rd
- 3041 Wood Thrush Dr
- 3007 Wood Thrush Dr
- 2997 Wood Thrush Dr