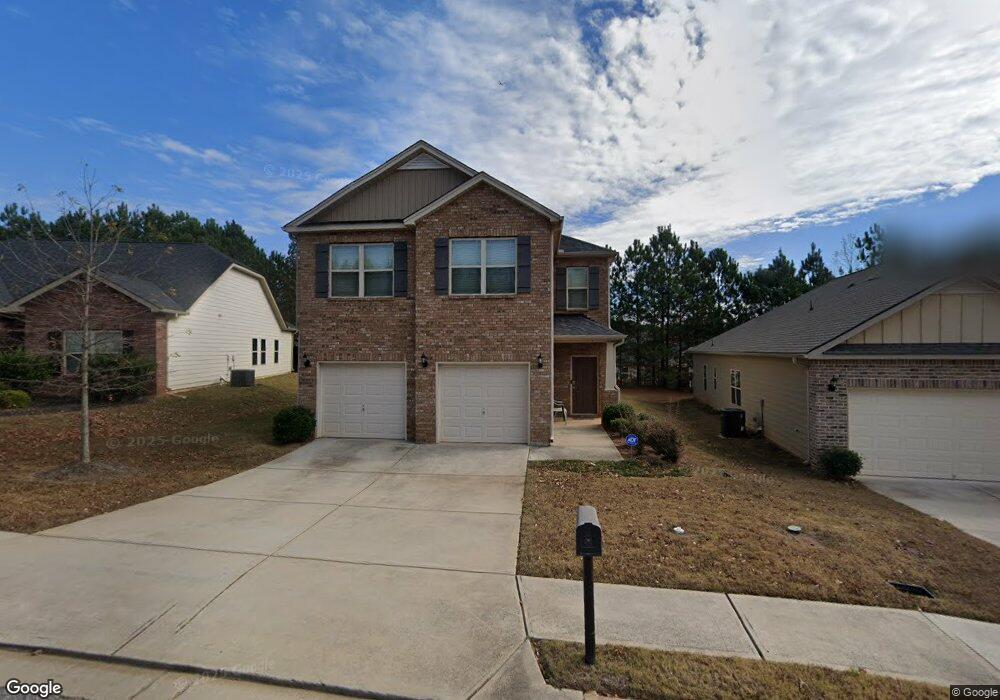
5118 Summerview Way Unit 130 Morrow, GA 30260
Estimated Value: $267,256 - $345,000
3
Beds
3
Baths
1,742
Sq Ft
$174/Sq Ft
Est. Value
About This Home
This home is located at 5118 Summerview Way Unit 130, Morrow, GA 30260 and is currently estimated at $302,314, approximately $173 per square foot. 5118 Summerview Way Unit 130 is a home located in Clayton County with nearby schools including Thurgood Marshall Elementary School, Morrow Middle School, and Morrow High School.
Ownership History
Date
Name
Owned For
Owner Type
Purchase Details
Closed on
Aug 6, 2024
Sold by
Bti 1179 Llc
Bought by
Neang Vy Tha and Tran Kevin
Current Estimated Value
Home Financials for this Owner
Home Financials are based on the most recent Mortgage that was taken out on this home.
Original Mortgage
$217,600
Outstanding Balance
$214,555
Interest Rate
6.89%
Mortgage Type
New Conventional
Estimated Equity
$87,759
Purchase Details
Closed on
Jan 17, 2024
Sold by
Cti 1379 Llc
Bought by
Bti 1179 Llc
Home Financials for this Owner
Home Financials are based on the most recent Mortgage that was taken out on this home.
Original Mortgage
$226,500
Interest Rate
6.61%
Mortgage Type
New Conventional
Purchase Details
Closed on
Jul 15, 2016
Sold by
Adams Homes Aec Llc
Bought by
Washington Audreyona Ashley
Home Financials for this Owner
Home Financials are based on the most recent Mortgage that was taken out on this home.
Original Mortgage
$149,246
Interest Rate
3.75%
Mortgage Type
FHA
Create a Home Valuation Report for This Property
The Home Valuation Report is an in-depth analysis detailing your home's value as well as a comparison with similar homes in the area
Home Values in the Area
Average Home Value in this Area
Purchase History
| Date | Buyer | Sale Price | Title Company |
|---|---|---|---|
| Neang Vy Tha | $290,000 | -- | |
| Bti 1179 Llc | -- | -- | |
| Cti 1379 Llc | $302,000 | -- | |
| Washington Audreyona Ashley | $152,000 | -- |
Source: Public Records
Mortgage History
| Date | Status | Borrower | Loan Amount |
|---|---|---|---|
| Open | Neang Vy Tha | $217,600 | |
| Previous Owner | Cti 1379 Llc | $226,500 | |
| Previous Owner | Washington Audreyona Ashley | $149,246 |
Source: Public Records
Tax History Compared to Growth
Tax History
| Year | Tax Paid | Tax Assessment Tax Assessment Total Assessment is a certain percentage of the fair market value that is determined by local assessors to be the total taxable value of land and additions on the property. | Land | Improvement |
|---|---|---|---|---|
| 2024 | $4,393 | $111,640 | $8,800 | $102,840 |
| 2023 | $5,245 | $145,280 | $8,800 | $136,480 |
| 2022 | $3,531 | $99,000 | $8,800 | $90,200 |
| 2021 | $2,479 | $71,800 | $8,800 | $63,000 |
| 2020 | $2,233 | $64,874 | $8,800 | $56,074 |
| 2019 | $2,025 | $58,941 | $5,600 | $53,341 |
| 2018 | $1,865 | $54,997 | $5,600 | $49,397 |
| 2017 | $1,774 | $52,673 | $5,600 | $47,073 |
| 2016 | $2,305 | $55,710 | $5,600 | $50,110 |
| 2015 | $262 | $0 | $0 | $0 |
| 2014 | $197 | $4,000 | $4,000 | $0 |
Source: Public Records
Map
Nearby Homes
- 0 3rd St
- 5420 Herndon Blvd
- 2183 Miranda Dr
- 2194 Miranda Dr
- 1639 Burks Dr
- 5372 Bryant Blvd
- 5385 Booker t Dr
- 5356 Creekview Way
- 3262 Anvil Block Rd
- 0 Herndon Blvd Unit 10625476
- 0 Herndon Blvd Unit 7686770
- 2247 Cypress Ave
- 1638 Dellwood Cir
- 1615 Dellwood Cir
- 5516 Bryant Blvd
- 0 Poplar Ave Unit 10580022
- 0 Poplar Ave Unit 10481115
- 0 Poplar Ave Unit 7543163
- 2616 Farn Dr
- 1822 Slate Rd
- 5118 Summerview Way
- 5118 Summerview Ln Unit 130
- 5118 Summerview Ln
- 5116 Summerview Way
- 5120 Summerview Way
- 5114 Summerview Way
- 5126 Summerview Way
- 5121 Summerview Way
- 5125 Summersun Dr
- 5121 Summersun Dr Unit 137
- 5112 Summerview Ln
- 5117 Summersun Dr
- 5117 Summerview Way
- 5131 Summersun Dr Unit 108
- 5113 Summersun Dr
- 4909 Summersun Dr
- 4917 Summersun Dr
- 5110 Summerview Way
- 5113 Summerview Way
- 5139 Summersun Dr