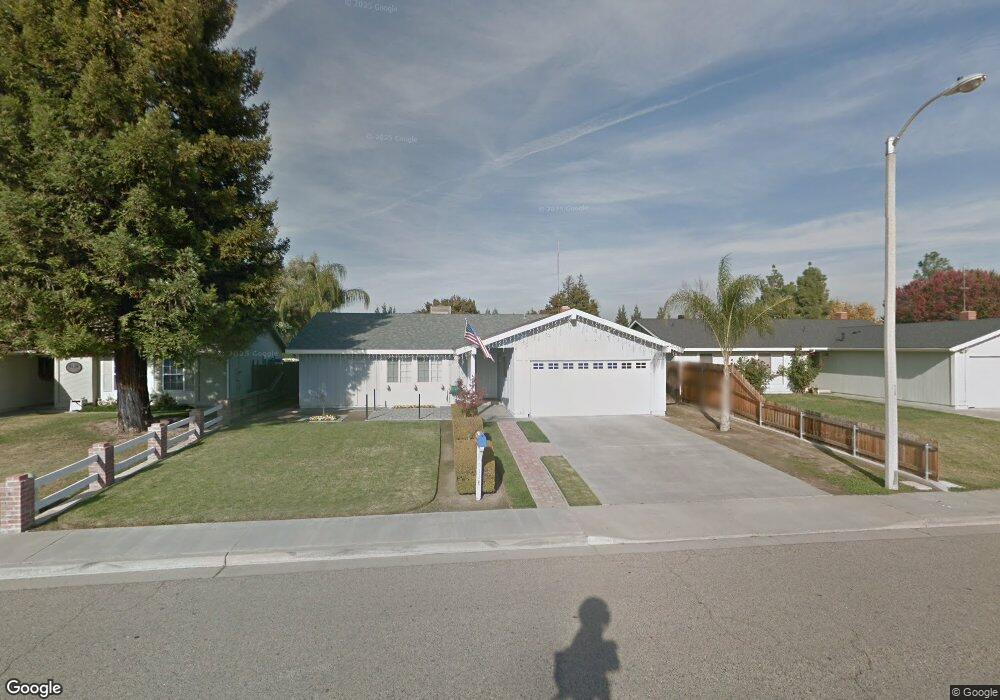
5118 W Dartmouth Ave Visalia, CA 93277
Estimated Value: $304,121 - $336,000
3
Beds
3
Baths
1,303
Sq Ft
$245/Sq Ft
Est. Value
About This Home
This home is located at 5118 W Dartmouth Ave, Visalia, CA 93277 and is currently estimated at $319,030, approximately $244 per square foot. 5118 W Dartmouth Ave is a home located in Tulare County with nearby schools including Veva Blunt Elementary School, La Joya Middle School, and El Diamante High School.
Ownership History
Date
Name
Owned For
Owner Type
Purchase Details
Closed on
Jan 8, 2021
Sold by
South Christi M and South Kevin
Bought by
South Christi M and South Kevin
Current Estimated Value
Home Financials for this Owner
Home Financials are based on the most recent Mortgage that was taken out on this home.
Original Mortgage
$65,000
Outstanding Balance
$58,013
Interest Rate
2.71%
Mortgage Type
New Conventional
Estimated Equity
$261,017
Purchase Details
Closed on
Feb 22, 2002
Sold by
South Kevin
Bought by
South Kevin and South Christi M
Home Financials for this Owner
Home Financials are based on the most recent Mortgage that was taken out on this home.
Original Mortgage
$83,250
Interest Rate
6.8%
Mortgage Type
Purchase Money Mortgage
Purchase Details
Closed on
Oct 7, 1995
Sold by
Strand Alan J
Bought by
South Kevin and Nilges Christi M
Home Financials for this Owner
Home Financials are based on the most recent Mortgage that was taken out on this home.
Original Mortgage
$84,611
Interest Rate
7.59%
Mortgage Type
FHA
Create a Home Valuation Report for This Property
The Home Valuation Report is an in-depth analysis detailing your home's value as well as a comparison with similar homes in the area
Home Values in the Area
Average Home Value in this Area
Purchase History
| Date | Buyer | Sale Price | Title Company |
|---|---|---|---|
| South Christi M | -- | Chicago Title Company | |
| South Kevin | -- | Fidelity National Title Co | |
| South Kevin | $85,000 | Chicago Title Co |
Source: Public Records
Mortgage History
| Date | Status | Borrower | Loan Amount |
|---|---|---|---|
| Open | South Christi M | $65,000 | |
| Closed | South Kevin | $83,250 | |
| Closed | South Kevin | $84,611 |
Source: Public Records
Tax History Compared to Growth
Tax History
| Year | Tax Paid | Tax Assessment Tax Assessment Total Assessment is a certain percentage of the fair market value that is determined by local assessors to be the total taxable value of land and additions on the property. | Land | Improvement |
|---|---|---|---|---|
| 2025 | $1,420 | $141,209 | $49,838 | $91,371 |
| 2024 | $1,420 | $138,441 | $48,861 | $89,580 |
| 2023 | $1,379 | $135,727 | $47,903 | $87,824 |
| 2022 | $1,335 | $133,066 | $46,964 | $86,102 |
| 2021 | $1,317 | $130,457 | $46,043 | $84,414 |
| 2020 | $1,300 | $129,119 | $45,571 | $83,548 |
| 2019 | $1,266 | $126,587 | $44,677 | $81,910 |
| 2018 | $1,228 | $124,105 | $43,801 | $80,304 |
| 2017 | $1,219 | $121,671 | $42,942 | $78,729 |
| 2016 | $1,190 | $119,285 | $42,100 | $77,185 |
| 2015 | $1,154 | $117,494 | $41,468 | $76,026 |
| 2014 | $1,154 | $115,193 | $40,656 | $74,537 |
Source: Public Records
Map
Nearby Homes
- 5505 W Tulare Ave Unit 24
- 5505 W Tulare Ave Unit 406
- 5505 W Tulare Ave Unit 113
- 5505 W Tulare Ave Unit 378
- 5505 W Tulare Ave Unit 15
- 5505 W Tulare Ave Unit 64
- 5505 W Tulare Ave Unit 379
- 4747 W Iris Ave
- 4737 W Iris Ave
- 1233 S Kent St
- 4615 W Feemster Ave
- 4614 W Howard Ave
- 5541 W Walnut Ave
- 5746 W Judy Ct
- 4438 W Feemster Ave
- 924 S Jennie St
- 5730 W Laura Ct
- Seville Plan at Andalusia
- Sydney Plan at Andalusia
- Aspen Plan at Andalusia
- 5128 W Dartmouth Ave
- 5110 W Dartmouth Ave
- 5115 W Howard Ave
- 5138 W Dartmouth Ave
- 5102 W Dartmouth Ave
- 5129 W Howard Ave
- 5123 W Dartmouth Ave
- 5111 W Dartmouth Ave
- 5139 W Howard Ave
- 5044 W Dartmouth Ave
- 5135 W Dartmouth Ave
- 5146 W Dartmouth Ave
- 1350 S Parkwood St
- 5101 W Dartmouth Ave
- 5147 W Howard Ave
- 5147 W Dartmouth Ave
- 5036 W Dartmouth Ave
- 5140 W Feemster Ct
- 5041 W Dartmouth Ave
- 1346 S Parkwood St