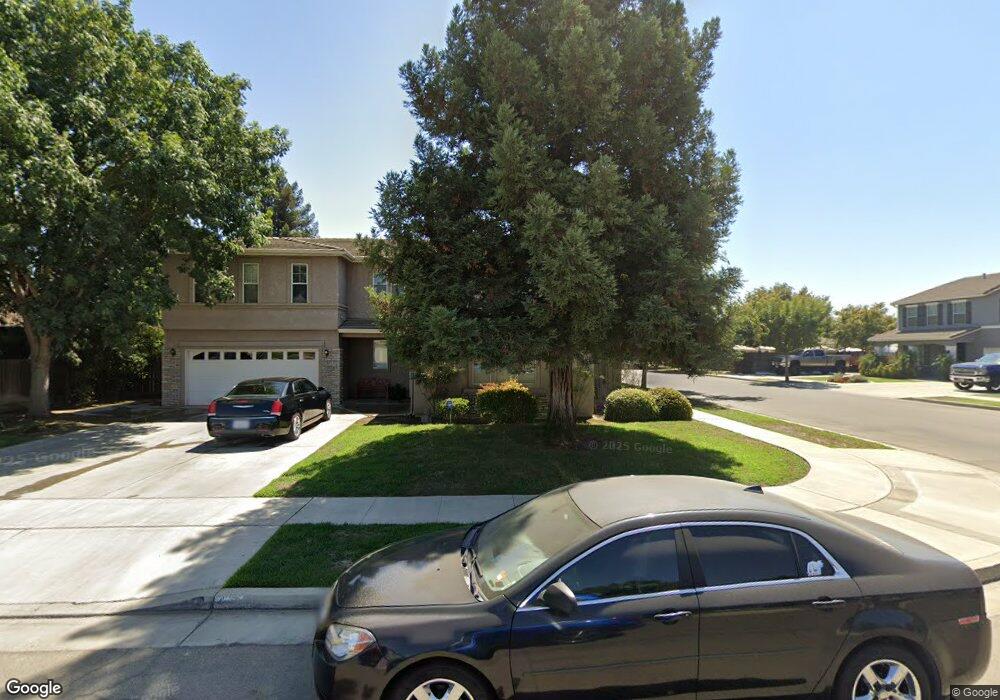
5119 W Concord Ave Visalia, CA 93277
Estimated Value: $456,599 - $488,000
4
Beds
2
Baths
1,889
Sq Ft
$250/Sq Ft
Est. Value
About This Home
This home is located at 5119 W Concord Ave, Visalia, CA 93277 and is currently estimated at $472,150, approximately $249 per square foot. 5119 W Concord Ave is a home located in Tulare County with nearby schools including Cottonwood Creek Elementary School, La Joya Middle School, and El Diamante High School.
Ownership History
Date
Name
Owned For
Owner Type
Purchase Details
Closed on
Jan 19, 2019
Sold by
Fink Charles L and Fink Gloria D
Bought by
Fink Charles Leroy and Fink Gloria
Current Estimated Value
Purchase Details
Closed on
Jul 13, 2012
Sold by
Summit Homebuilders Inc
Bought by
Hardy Matthew
Home Financials for this Owner
Home Financials are based on the most recent Mortgage that was taken out on this home.
Original Mortgage
$268,000
Interest Rate
3.28%
Mortgage Type
VA
Purchase Details
Closed on
Mar 19, 2010
Sold by
Te Velde Bernard Alan
Bought by
Summit Homebuilders Inc
Home Financials for this Owner
Home Financials are based on the most recent Mortgage that was taken out on this home.
Original Mortgage
$3,440,000
Interest Rate
4.88%
Mortgage Type
Seller Take Back
Purchase Details
Closed on
Dec 24, 2008
Sold by
Reynen & Bardis Communities Inc
Bought by
Tevelde Bernard Alan and Tevelde Rebecca D
Create a Home Valuation Report for This Property
The Home Valuation Report is an in-depth analysis detailing your home's value as well as a comparison with similar homes in the area
Home Values in the Area
Average Home Value in this Area
Purchase History
| Date | Buyer | Sale Price | Title Company |
|---|---|---|---|
| Fink Charles Leroy | -- | None Available | |
| Hardy Matthew | $276,000 | None Available | |
| Summit Homebuilders Inc | -- | Chicago Title Company | |
| Tevelde Bernard Alan | $2,064,000 | Chicago Title Company |
Source: Public Records
Mortgage History
| Date | Status | Borrower | Loan Amount |
|---|---|---|---|
| Previous Owner | Hardy Matthew | $268,000 | |
| Previous Owner | Summit Homebuilders Inc | $3,440,000 |
Source: Public Records
Tax History Compared to Growth
Tax History
| Year | Tax Paid | Tax Assessment Tax Assessment Total Assessment is a certain percentage of the fair market value that is determined by local assessors to be the total taxable value of land and additions on the property. | Land | Improvement |
|---|---|---|---|---|
| 2025 | $3,582 | $380,058 | $84,351 | $295,707 |
| 2024 | $3,582 | $332,607 | $82,698 | $249,909 |
| 2023 | $3,484 | $326,086 | $81,077 | $245,009 |
| 2022 | $3,385 | $319,693 | $79,488 | $240,205 |
| 2021 | $3,324 | $313,424 | $77,929 | $235,495 |
| 2020 | $3,318 | $310,210 | $77,130 | $233,080 |
| 2019 | $3,201 | $304,128 | $75,618 | $228,510 |
| 2018 | $3,143 | $298,164 | $74,135 | $224,029 |
| 2017 | $3,087 | $292,317 | $72,681 | $219,636 |
| 2016 | $3,051 | $286,585 | $71,256 | $215,329 |
| 2015 | $2,957 | $282,281 | $70,186 | $212,095 |
| 2014 | $2,957 | $276,751 | $68,811 | $207,940 |
Source: Public Records
Map
Nearby Homes
- 4024 S Parkwood St
- 3933 S Parkwood St
- 4038 S Atwood St
- 4924 W Elkhorn Ave
- 5141 W Chestnut Ave
- 3131 S Parkwood St
- 4218 W Redding Ave
- 27387 Road 100
- 4228 S Julieann Ct
- 4105 W Concord Ct
- 4036 W Rialto Ave
- 2223 S Julieann St Unit 1032v
- 2346 S Julieann St Unit 1067v
- 2826 S Avocado Ct
- 4523 W Evergreen Ct
- 4633 W Cherry Ave
- 3335 W Florence Ave
- 3346 W Good Ave
- 4537 S Ernest St
- 3737 W Victor Ave
- 5103 W Concord Ave
- 5135 W Concord Ave
- 5061 W Concord Ave
- 5110 W Rialto Ct
- 4025 S San Joaquin St
- 5132 W Rialto Ct
- 5052 W Rialto Ct
- 5055 W Concord Ave
- 5205 W Concord Ave
- 4013 S San Joaquin St
- 4012 S Parkwood St
- 4026 S San Joaquin St
- 5144 W Rialto Ct
- 5046 W Rialto Ct
- 4023 S Parkwood St
- 5049 W Concord Ave
- 5213 W Concord Ave
- 4003 S San Joaquin St
- 4002 S Parkwood St
- 4011 S Parkwood St