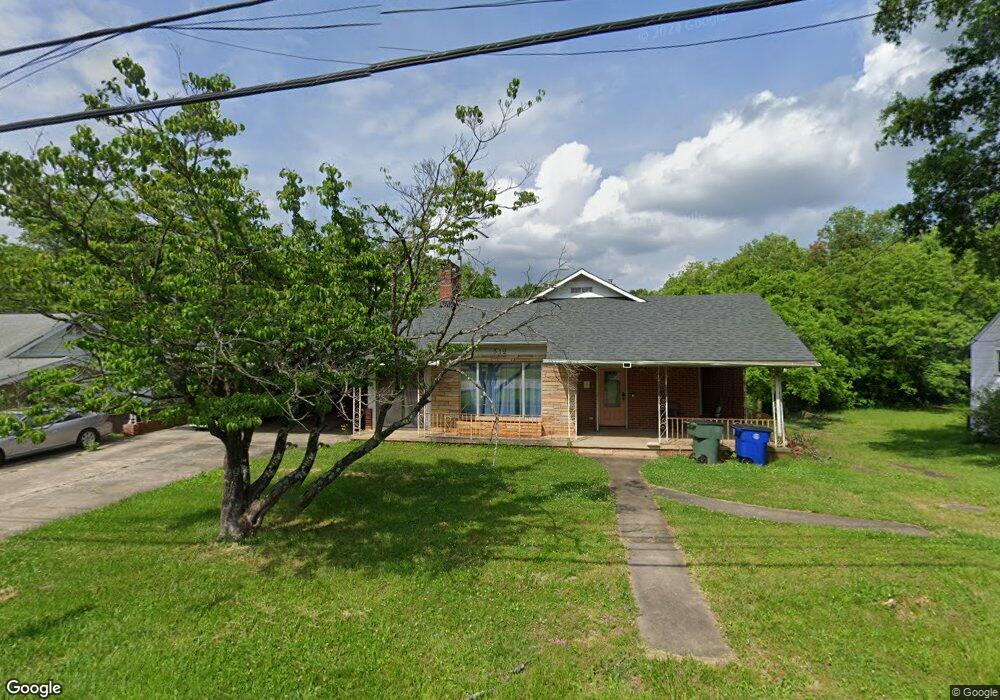
512 1st St W Conover, NC 28613
Estimated Value: $198,000 - $267,000
3
Beds
2
Baths
1,499
Sq Ft
$155/Sq Ft
Est. Value
About This Home
This home is located at 512 1st St W, Conover, NC 28613 and is currently estimated at $232,636, approximately $155 per square foot. 512 1st St W is a home located in Catawba County with nearby schools including Shuford Elementary School, Newton-Conover Middle School, and Newton-Conover High School.
Ownership History
Date
Name
Owned For
Owner Type
Purchase Details
Closed on
Mar 29, 2017
Sold by
Klutz Cochran Alicia Danielle
Bought by
Cochran Michael Lloyd
Current Estimated Value
Purchase Details
Closed on
Jun 24, 2010
Sold by
Hubert Jason
Bought by
Cochran Alicia Danielle Klutz and Cochran Michael Lloyd
Home Financials for this Owner
Home Financials are based on the most recent Mortgage that was taken out on this home.
Original Mortgage
$71,472
Outstanding Balance
$47,665
Interest Rate
4.87%
Mortgage Type
FHA
Estimated Equity
$184,971
Create a Home Valuation Report for This Property
The Home Valuation Report is an in-depth analysis detailing your home's value as well as a comparison with similar homes in the area
Home Values in the Area
Average Home Value in this Area
Purchase History
| Date | Buyer | Sale Price | Title Company |
|---|---|---|---|
| Cochran Michael Lloyd | -- | None Available | |
| Cochran Alicia Danielle Klutz | $75,000 | None Available |
Source: Public Records
Mortgage History
| Date | Status | Borrower | Loan Amount |
|---|---|---|---|
| Open | Cochran Alicia Danielle Klutz | $71,472 |
Source: Public Records
Tax History
| Year | Tax Paid | Tax Assessment Tax Assessment Total Assessment is a certain percentage of the fair market value that is determined by local assessors to be the total taxable value of land and additions on the property. | Land | Improvement |
|---|---|---|---|---|
| 2025 | $1,497 | $142,600 | $30,400 | $112,200 |
| 2024 | $1,497 | $142,600 | $30,400 | $112,200 |
| 2023 | $1,132 | $142,600 | $30,400 | $112,200 |
| 2022 | $1,032 | $96,000 | $25,400 | $70,600 |
| 2021 | $1,032 | $96,000 | $25,400 | $70,600 |
| 2020 | $1,032 | $96,000 | $25,400 | $70,600 |
| 2019 | $1,032 | $96,000 | $0 | $0 |
| 2018 | $1,037 | $96,500 | $30,400 | $66,100 |
| 2017 | $1,008 | $0 | $0 | $0 |
| 2016 | $1,008 | $0 | $0 | $0 |
| 2015 | $855 | $96,500 | $30,400 | $66,100 |
| 2014 | $963 | $103,500 | $33,000 | $70,500 |
Source: Public Records
Map
Nearby Homes
- 603 2nd Street Place SW
- 630 2nd St SW
- 215 Towne Ct NW
- 713 2nd Street Place SW
- 603 1st Avenue Place NE
- 203 3rd Ave NE
- 712 2nd Ave NW
- 705 2nd Ave NE
- 605 6th St SW
- 611 6th St SW
- 503 9th Ave SW
- 605 8th Ave SW Unit A-1
- 605 8th Ave SW Unit C-1
- 718 2nd Ave NE
- 105 9th St SE
- 109 9th St SE
- 1017 3rd Ave NW
- 505 2nd Street Place NE Unit D2
- 505 2nd Street Place NE Unit B2
- 701 3rd St SE
- 506 1st St W
- 516 1st St W
- 518 1st St W
- 518 1st St W
- 520 1st St W
- 602 1st St W
- 409 3rd St NW
- 615 4th St SW
- 563 4th Street Place SW
- 615 4th Street Place SW
- 604 1st St W
- 412 3rd St NW
- 407 3rd St NW
- 613 2nd Street Dr SW
- 410 3rd St NW
- 615 2nd Street Dr SW
- 406 3rd St NW
- 617 2nd Street Dr SW
- 608 1st St W
- 311 3rd St NW
Your Personal Tour Guide
Ask me questions while you tour the home.