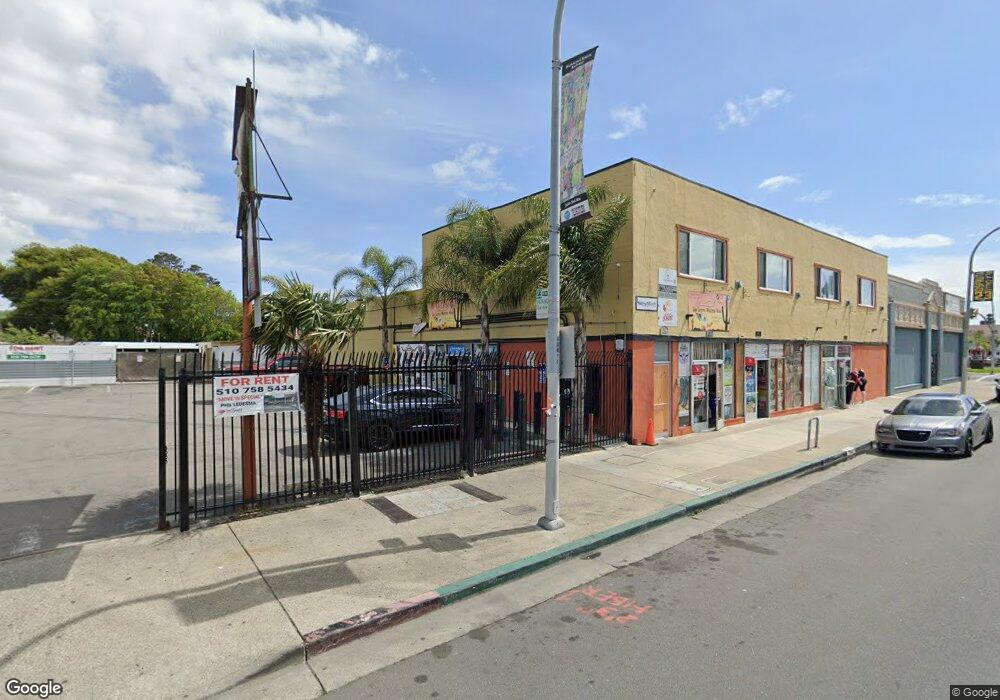
512 23rd St Richmond, CA 94804
North & East Neighborhood
--
Bed
--
Bath
7,500
Sq Ft
1.65
Acres
About This Home
This home is located at 512 23rd St, Richmond, CA 94804. 512 23rd St is a home located in Contra Costa County with nearby schools including Grant Elementary School, Lovonya DeJean Middle School, and John F. Kennedy High School.
Ownership History
Date
Name
Owned For
Owner Type
Purchase Details
Closed on
Sep 10, 2018
Sold by
Ledesma Griselda
Bought by
Lm Holdings 2 Llc
Purchase Details
Closed on
Jun 8, 2018
Sold by
Ledesma Leticia
Bought by
Ledesma Grisselda
Home Financials for this Owner
Home Financials are based on the most recent Mortgage that was taken out on this home.
Original Mortgage
$550,000
Interest Rate
4.5%
Mortgage Type
Construction
Create a Home Valuation Report for This Property
The Home Valuation Report is an in-depth analysis detailing your home's value as well as a comparison with similar homes in the area
Home Values in the Area
Average Home Value in this Area
Purchase History
| Date | Buyer | Sale Price | Title Company |
|---|---|---|---|
| Lm Holdings 2 Llc | -- | None Available | |
| Ledesma Grisselda | -- | Fidelity National Title Comp | |
| Ledesma Griselda | -- | Fidelity National Title Comp |
Source: Public Records
Mortgage History
| Date | Status | Borrower | Loan Amount |
|---|---|---|---|
| Previous Owner | Ledesma Griselda | $550,000 |
Source: Public Records
Tax History Compared to Growth
Tax History
| Year | Tax Paid | Tax Assessment Tax Assessment Total Assessment is a certain percentage of the fair market value that is determined by local assessors to be the total taxable value of land and additions on the property. | Land | Improvement |
|---|---|---|---|---|
| 2025 | $14,695 | $868,574 | $157,442 | $711,132 |
| 2024 | $15,530 | $851,544 | $154,355 | $697,189 |
| 2023 | $15,530 | $834,848 | $151,329 | $683,519 |
| 2022 | $14,511 | $818,479 | $148,362 | $670,117 |
| 2021 | $14,691 | $849,186 | $144,279 | $704,907 |
| 2019 | $12,915 | $778,633 | $141,140 | $637,493 |
| 2018 | $12,237 | $763,367 | $138,373 | $624,994 |
| 2017 | $11,105 | $683,400 | $135,660 | $547,740 |
| 2016 | $6,148 | $176,004 | $64,596 | $111,408 |
| 2015 | $8,530 | $173,361 | $63,626 | $109,735 |
| 2014 | $9,148 | $169,966 | $62,380 | $107,586 |
Source: Public Records
Map
Nearby Homes