512 3rd Ave NE Conover, NC 28613
Estimated Value: $348,208 - $419,000
3
Beds
3
Baths
2,154
Sq Ft
$184/Sq Ft
Est. Value
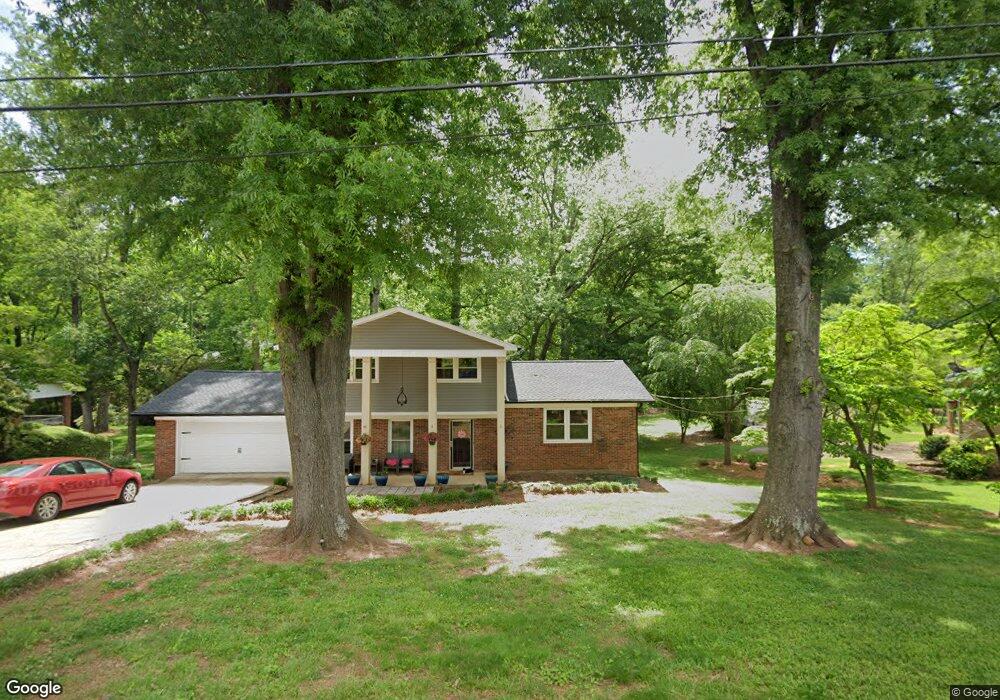
About This Home
This home is located at 512 3rd Ave NE, Conover, NC 28613 and is currently estimated at $396,052, approximately $183 per square foot. 512 3rd Ave NE is a home located in Catawba County with nearby schools including Shuford Elementary School, Newton-Conover Middle School, and Newton-Conover High School.
Ownership History
Date
Name
Owned For
Owner Type
Purchase Details
Closed on
Feb 23, 2023
Sold by
Herbert Heather
Bought by
Herbert Gregg R
Current Estimated Value
Home Financials for this Owner
Home Financials are based on the most recent Mortgage that was taken out on this home.
Original Mortgage
$80,500
Outstanding Balance
$63,383
Interest Rate
5%
Mortgage Type
New Conventional
Estimated Equity
$332,669
Purchase Details
Closed on
Sep 5, 2018
Sold by
Herbert Heather
Bought by
Herbert Gregg R
Home Financials for this Owner
Home Financials are based on the most recent Mortgage that was taken out on this home.
Original Mortgage
$134,400
Interest Rate
4.5%
Mortgage Type
New Conventional
Purchase Details
Closed on
Dec 1, 1993
Bought by
Herbert Gregg Rodney and Herbert Tracy L
Create a Home Valuation Report for This Property
The Home Valuation Report is an in-depth analysis detailing your home's value as well as a comparison with similar homes in the area
Home Values in the Area
Average Home Value in this Area
Purchase History
| Date | Buyer | Sale Price | Title Company |
|---|---|---|---|
| Herbert Gregg R | -- | -- | |
| Herbert Gregg R | -- | None Available | |
| Herbert Gregg Rodney | $112,500 | -- |
Source: Public Records
Mortgage History
| Date | Status | Borrower | Loan Amount |
|---|---|---|---|
| Open | Herbert Gregg R | $80,500 | |
| Previous Owner | Herbert Gregg R | $134,400 |
Source: Public Records
Tax History
| Year | Tax Paid | Tax Assessment Tax Assessment Total Assessment is a certain percentage of the fair market value that is determined by local assessors to be the total taxable value of land and additions on the property. | Land | Improvement |
|---|---|---|---|---|
| 2025 | $2,277 | $286,900 | $22,800 | $264,100 |
| 2024 | $2,277 | $286,900 | $22,800 | $264,100 |
| 2023 | $2,277 | $286,900 | $22,800 | $264,100 |
| 2022 | $1,983 | $184,500 | $22,800 | $161,700 |
| 2021 | $1,983 | $184,500 | $22,800 | $161,700 |
| 2020 | $1,983 | $184,500 | $22,800 | $161,700 |
| 2019 | $1,983 | $184,500 | $0 | $0 |
| 2018 | $1,967 | $183,000 | $22,900 | $160,100 |
| 2017 | $1,912 | $0 | $0 | $0 |
| 2016 | $1,912 | $0 | $0 | $0 |
| 2015 | $1,690 | $183,000 | $22,900 | $160,100 |
| 2014 | $1,690 | $181,700 | $25,200 | $156,500 |
Source: Public Records
Map
Nearby Homes
- 510 4th Ave NE
- 611 5th Ave NE Unit PT21&22/L
- 710 4th Ave NE
- 306 7th Street Place NE
- 406 5th Ave NE
- 510 7th St NE
- 513 2nd Avenue Place NE
- 507 7th St NE Unit 29
- 705 2nd Ave NE
- 203 8th St NE
- 404 Thornburg Dr NE
- 505 2nd Street Place NE Unit D2
- 505 2nd Street Place NE Unit B2
- 603 1st Avenue Place NE
- 1002 4th St NE
- 712 2nd Ave NW
- 110 10th St NW
- 406 Rock Barn Rd NE
- 4500 N Nc 16 Hwy Unit 5-17/B
- 215 Towne Ct NW
- 514 3rd Ave NE
- 510 3rd Ave NE
- 511 4th Ave NE
- 509 3rd Ave NE
- 601 4th Ave NE
- 604 3rd Ave NE
- 508 3rd Ave NE
- 507 4th Ave NE
- 215 6th St NE
- 605 4th Ave NE
- 505 3rd Ave NE
- 208 6th St NE
- 305 5th Street Place NE
- 305 5th Street Place NE Unit PT1
- 213 6th St NE
- 606 3rd Ave NE
- 0 3rd Ave NE Unit 9540904
- 216 7th St NE
- 206 6th St NE
- 512 4th Ave NE
Your Personal Tour Guide
Ask me questions while you tour the home.