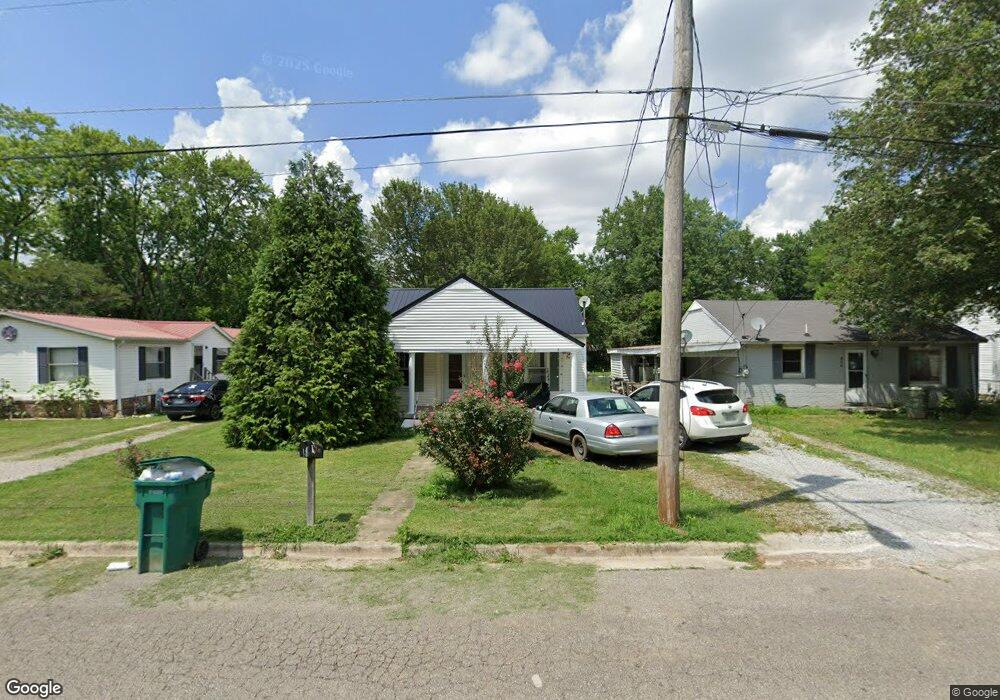
512 4th St Lawrenceburg, TN 38464
Estimated Value: $75,000 - $155,000
--
Bed
1
Bath
854
Sq Ft
$115/Sq Ft
Est. Value
About This Home
This home is located at 512 4th St, Lawrenceburg, TN 38464 and is currently estimated at $98,025, approximately $114 per square foot. 512 4th St is a home located in Lawrence County with nearby schools including Ingram Sowell Elementary School, Lawrenceburg Public Elementary School, and David Crockett Elementary School.
Ownership History
Date
Name
Owned For
Owner Type
Purchase Details
Closed on
Dec 1, 2023
Sold by
Kilburn Steve
Bought by
Shackelford Jerry B
Current Estimated Value
Purchase Details
Closed on
Sep 11, 2019
Sold by
Martin Genevia
Bought by
Kilburn Steve
Purchase Details
Closed on
Mar 21, 2005
Sold by
Swartz & Brough Inc
Bought by
Richard Martin
Home Financials for this Owner
Home Financials are based on the most recent Mortgage that was taken out on this home.
Original Mortgage
$29,700
Interest Rate
5.61%
Purchase Details
Closed on
Feb 15, 2005
Sold by
Farr Virgil F and Farr Estate
Bought by
Swartz & Brough Inc
Home Financials for this Owner
Home Financials are based on the most recent Mortgage that was taken out on this home.
Original Mortgage
$29,700
Interest Rate
5.61%
Purchase Details
Closed on
Sep 16, 1983
Bought by
Farr Virgil F
Purchase Details
Closed on
Jan 1, 1983
Purchase Details
Closed on
Jan 2, 1981
Purchase Details
Closed on
Jan 1, 1981
Purchase Details
Closed on
Jan 1, 1980
Create a Home Valuation Report for This Property
The Home Valuation Report is an in-depth analysis detailing your home's value as well as a comparison with similar homes in the area
Home Values in the Area
Average Home Value in this Area
Purchase History
| Date | Buyer | Sale Price | Title Company |
|---|---|---|---|
| Shackelford Jerry B | $600,000 | None Listed On Document | |
| Kilburn Steve | $30,000 | None Available | |
| Richard Martin | $33,000 | -- | |
| Swartz & Brough Inc | $21,000 | -- | |
| Farr Virgil F | -- | -- | |
| -- | $15,800 | -- | |
| -- | $21,400 | -- | |
| -- | $20,000 | -- | |
| -- | $24,000 | -- |
Source: Public Records
Mortgage History
| Date | Status | Borrower | Loan Amount |
|---|---|---|---|
| Previous Owner | Not Available | $29,700 |
Source: Public Records
Tax History Compared to Growth
Tax History
| Year | Tax Paid | Tax Assessment Tax Assessment Total Assessment is a certain percentage of the fair market value that is determined by local assessors to be the total taxable value of land and additions on the property. | Land | Improvement |
|---|---|---|---|---|
| 2025 | $455 | $14,625 | $0 | $0 |
| 2024 | $455 | $14,625 | $1,500 | $13,125 |
| 2023 | $455 | $14,625 | $1,500 | $13,125 |
| 2022 | $455 | $14,625 | $1,500 | $13,125 |
| 2021 | $371 | $8,450 | $1,500 | $6,950 |
| 2020 | $371 | $8,450 | $1,500 | $6,950 |
| 2019 | $371 | $8,450 | $1,500 | $6,950 |
| 2018 | $371 | $8,450 | $1,500 | $6,950 |
| 2017 | $371 | $8,450 | $1,500 | $6,950 |
| 2016 | $371 | $8,450 | $1,500 | $6,950 |
| 2015 | $352 | $8,450 | $1,500 | $6,950 |
| 2014 | $346 | $8,325 | $1,500 | $6,825 |
Source: Public Records
Map
Nearby Homes