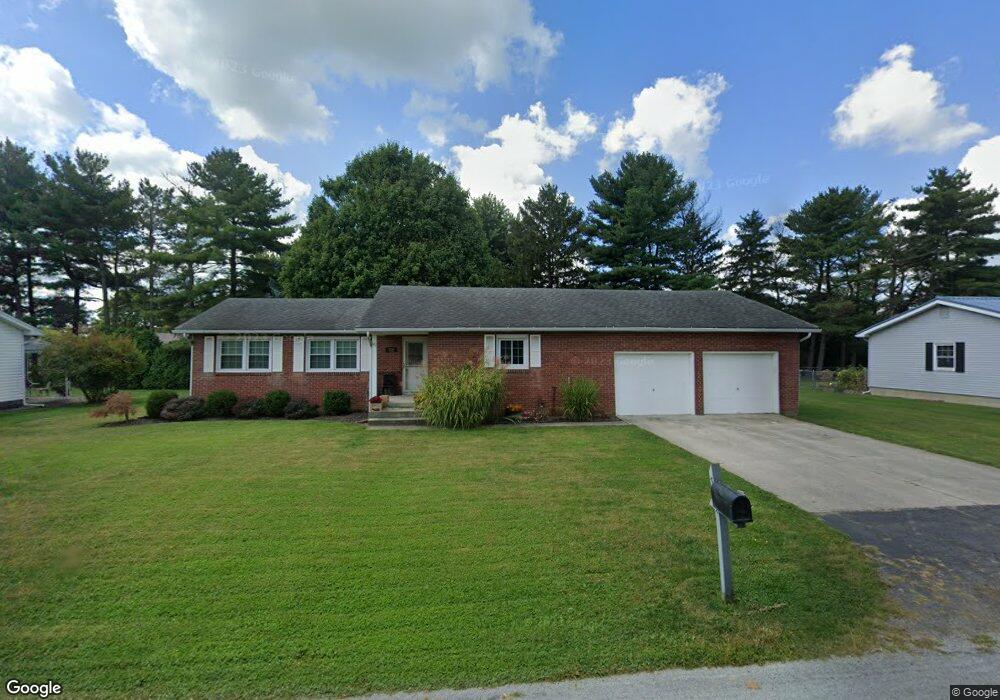
512 Baker Ct Upper Sandusky, OH 43351
Estimated Value: $190,143 - $237,000
3
Beds
2
Baths
1,272
Sq Ft
$166/Sq Ft
Est. Value
About This Home
This home is located at 512 Baker Ct, Upper Sandusky, OH 43351 and is currently estimated at $210,536, approximately $165 per square foot. 512 Baker Ct is a home located in Wyandot County with nearby schools including Upper Sandusky High School and St. Peter Elementary School.
Ownership History
Date
Name
Owned For
Owner Type
Purchase Details
Closed on
Nov 22, 2019
Sold by
Ellcessor Steven and Ellcessor Misty Jo
Bought by
Steinhour Justin L and Stieinhour Tiffiny M
Current Estimated Value
Home Financials for this Owner
Home Financials are based on the most recent Mortgage that was taken out on this home.
Original Mortgage
$171,212
Outstanding Balance
$149,659
Interest Rate
3.5%
Estimated Equity
$60,877
Purchase Details
Closed on
Apr 16, 2015
Sold by
Ellcessor Kelly
Bought by
Ellecessor Steve
Purchase Details
Closed on
May 10, 2013
Sold by
Evans Alecia A and Cochran Alecia A
Bought by
Ellcessor Kelly S
Home Financials for this Owner
Home Financials are based on the most recent Mortgage that was taken out on this home.
Original Mortgage
$120,408
Interest Rate
3.38%
Purchase Details
Closed on
Sep 27, 2007
Sold by
Margraf Betty J and Bradley Donnal J
Bought by
Cochran Alecia A
Home Financials for this Owner
Home Financials are based on the most recent Mortgage that was taken out on this home.
Original Mortgage
$94,400
Interest Rate
6.49%
Create a Home Valuation Report for This Property
The Home Valuation Report is an in-depth analysis detailing your home's value as well as a comparison with similar homes in the area
Home Values in the Area
Average Home Value in this Area
Purchase History
| Date | Buyer | Sale Price | Title Company |
|---|---|---|---|
| Steinhour Justin L | $169,500 | None Available | |
| Ellecessor Steve | -- | None Available | |
| Ellcessor Kelly S | $115,000 | None Available | |
| Cochran Alecia A | $118,000 | None Available |
Source: Public Records
Mortgage History
| Date | Status | Borrower | Loan Amount |
|---|---|---|---|
| Open | Steinhour Justin L | $171,212 | |
| Previous Owner | Ellcessor Kelly S | $120,408 | |
| Previous Owner | Cochran Alecia A | $94,400 |
Source: Public Records
Tax History
| Year | Tax Paid | Tax Assessment Tax Assessment Total Assessment is a certain percentage of the fair market value that is determined by local assessors to be the total taxable value of land and additions on the property. | Land | Improvement |
|---|---|---|---|---|
| 2025 | $1,631 | $54,210 | $7,930 | $46,280 |
| 2024 | $1,477 | $46,410 | $6,700 | $39,710 |
| 2023 | $1,477 | $46,410 | $6,700 | $39,710 |
| 2022 | $1,477 | $36,080 | $5,440 | $30,640 |
| 2021 | $1,202 | $36,080 | $5,440 | $30,640 |
| 2020 | $1,202 | $36,080 | $5,440 | $30,640 |
| 2019 | $1,199 | $36,080 | $5,440 | $30,640 |
| 2018 | $1,082 | $33,170 | $5,120 | $28,050 |
| 2017 | $1,100 | $33,170 | $5,120 | $28,050 |
| 2016 | -- | $33,170 | $5,120 | $28,050 |
| 2015 | -- | $32,090 | $5,120 | $26,970 |
| 2014 | -- | $32,090 | $5,120 | $26,970 |
| 2013 | -- | $32,090 | $5,120 | $26,970 |
Source: Public Records
Map
Nearby Homes
- 605 Polaris Dr
- 386 W Finley St
- 512 N 7th St
- 212 N Hazel St
- 9768 County Highway 111
- 137 N 8th St
- 479 N 5th St
- 333 N 5th St
- 225 S Hazel St
- 116 E Walker St
- 334 N 4th St
- 314 N 4th St
- 0 Ohio 53
- 326 S 8th St
- 432 E Bigelow St
- 387 S Warpole St
- 479 Front St
- 430 S Sandusky Ave
- 0 State Route 53 & 67 Unit 11165687
- 379 W Spring St
- 0 Baker Ct Unit H116660
- 0 Baker Ct Unit H135148
- 0 Baker Ct Unit H136220
- 502 Baker Ct
- 522 Baker Ct
- 533 Baker Ct
- 814 Kroger Dr
- 513 Baker Ct
- 525 Betty Lou St
- 535 Betty Lou St
- 503 Baker Ct
- 523 Baker Ct
- 816 Kroger Dr
- 532 Baker Ct
- 545 Betty Lou St
- 811 Kroger Dr
- 801 Kroger Dr
- 815 Kroger Dr
- 565 Betty Lou St
- 00 Betty Lou St
Your Personal Tour Guide
Ask me questions while you tour the home.