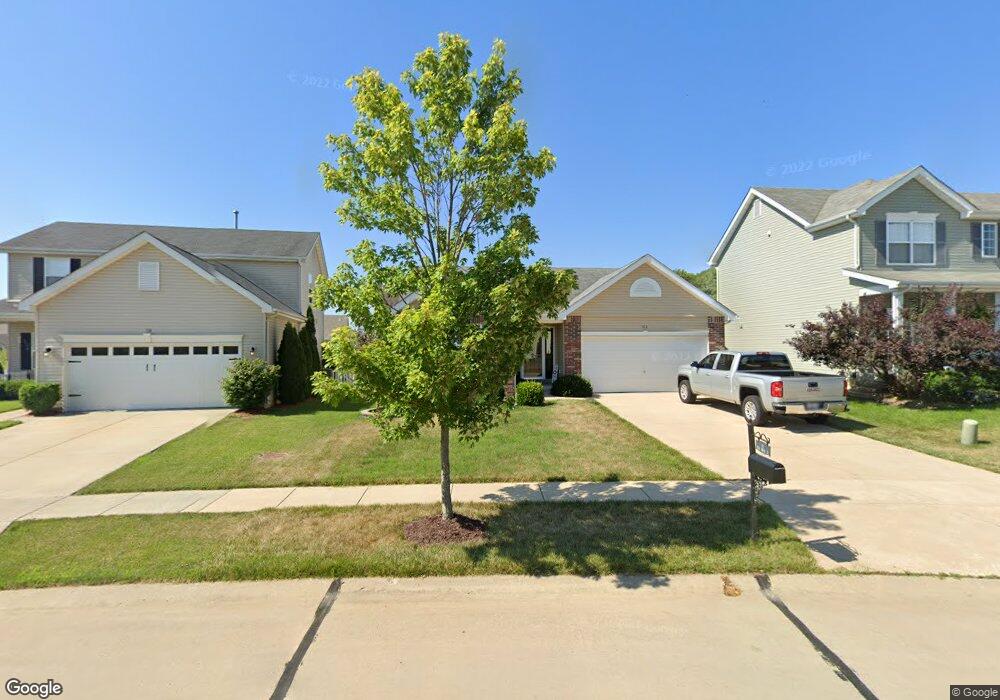
512 Deer Brook Dr Unit 575 O Fallon, MO 63366
Estimated Value: $341,000 - $356,000
3
Beds
2
Baths
1,300
Sq Ft
$267/Sq Ft
Est. Value
About This Home
This home is located at 512 Deer Brook Dr Unit 575, O Fallon, MO 63366 and is currently estimated at $347,418, approximately $267 per square foot. 512 Deer Brook Dr Unit 575 is a home located in St. Charles County with nearby schools including Mount Hope Elementary School, Fort Zumwalt North Middle School, and Fort Zumwalt North High School.
Ownership History
Date
Name
Owned For
Owner Type
Purchase Details
Closed on
Mar 9, 2023
Sold by
Middeke Tanner C and Middeke Christina L
Bought by
Kohl Andrew and Kohl Amy
Current Estimated Value
Home Financials for this Owner
Home Financials are based on the most recent Mortgage that was taken out on this home.
Original Mortgage
$221,250
Outstanding Balance
$214,304
Interest Rate
6.13%
Mortgage Type
New Conventional
Estimated Equity
$133,114
Purchase Details
Closed on
Apr 30, 2019
Sold by
Barry Davin and Barry Rachel
Bought by
Middeke Tanner C and Lifritz Christina L
Home Financials for this Owner
Home Financials are based on the most recent Mortgage that was taken out on this home.
Original Mortgage
$218,469
Interest Rate
4.12%
Mortgage Type
FHA
Purchase Details
Closed on
Jun 11, 2012
Sold by
Mcbride Brookside Llc
Bought by
Barry Devin and Barry Rachel
Home Financials for this Owner
Home Financials are based on the most recent Mortgage that was taken out on this home.
Original Mortgage
$149,150
Interest Rate
3.86%
Mortgage Type
New Conventional
Purchase Details
Closed on
Dec 19, 2011
Sold by
Charford Inc
Bought by
Mcbride Brookside Llc
Create a Home Valuation Report for This Property
The Home Valuation Report is an in-depth analysis detailing your home's value as well as a comparison with similar homes in the area
Home Values in the Area
Average Home Value in this Area
Purchase History
| Date | Buyer | Sale Price | Title Company |
|---|---|---|---|
| Kohl Andrew | -- | -- | |
| Middeke Tanner C | $222,500 | Investors Title Company | |
| Barry Devin | $157,000 | Dependable Title Llc | |
| Mcbride Brookside Llc | -- | Benchmark Title Llc |
Source: Public Records
Mortgage History
| Date | Status | Borrower | Loan Amount |
|---|---|---|---|
| Open | Kohl Andrew | $221,250 | |
| Previous Owner | Middeke Tanner C | $218,469 | |
| Previous Owner | Barry Devin | $149,150 |
Source: Public Records
Tax History
| Year | Tax Paid | Tax Assessment Tax Assessment Total Assessment is a certain percentage of the fair market value that is determined by local assessors to be the total taxable value of land and additions on the property. | Land | Improvement |
|---|---|---|---|---|
| 2025 | $3,532 | $54,651 | -- | -- |
| 2023 | $3,535 | $54,872 | $0 | $0 |
| 2022 | $2,941 | $42,506 | $0 | $0 |
| 2021 | $2,948 | $42,506 | $0 | $0 |
| 2020 | $2,732 | $37,528 | $0 | $0 |
| 2019 | $2,742 | $37,528 | $0 | $0 |
| 2018 | $2,502 | $32,678 | $0 | $0 |
| 2017 | $2,477 | $32,678 | $0 | $0 |
| 2016 | $2,306 | $29,304 | $0 | $0 |
| 2015 | $2,125 | $29,304 | $0 | $0 |
| 2014 | $2,008 | $28,489 | $0 | $0 |
Source: Public Records
Map
Nearby Homes
- 540 Deer Brook Dr
- 30 +/- AC Guthrie Rd
- 10 Brushy Brook Ct
- 102 Knoll Brook Dr
- 0 Mexico Rd Unit 22032692
- 30+/-AC Guthrie Rd
- 200 Brookview Way Ct
- 133 Harbor View Dr
- 191 Harbor View Dr
- 75 Schooner Ln Unit 5
- 54 Schooner Ln Unit 4
- 102 Prominence Point Ct
- 25 Bedford Way
- 1 Manderly Place Dr
- 628 Beaver Ct
- 15 Eagles Way Ln
- 266 Savoy Dr
- 2 Riviera Ct
- 22 Holloway Dr
- 4 Riviera Ct
- 512 Deer Brook Dr
- 514 Deer Brook Dr
- 510 Deer Brook Dr
- 508 Deer Brook Dr
- 65 White Brook Ct
- 65 White Brook Ct Unit 580
- 516 Deer Brook Dr
- 67 White Brook Ct
- 506 Deer Brook Dr
- 506 Deer Brook Dr Unit 572
- 515 Deer Brook Dr
- 61 White Brook Ct
- 517 Deer Brook Dr
- 63 White Brook Ct
- 504 Deer Brook Dr Unit 571
- 504 Deer Brook Dr
- 69 White Brook Ct
- 511 Deer Brook Dr
- 502 Deer Brook Dr
- 502 Deer Brook Dr Unit 570
Your Personal Tour Guide
Ask me questions while you tour the home.