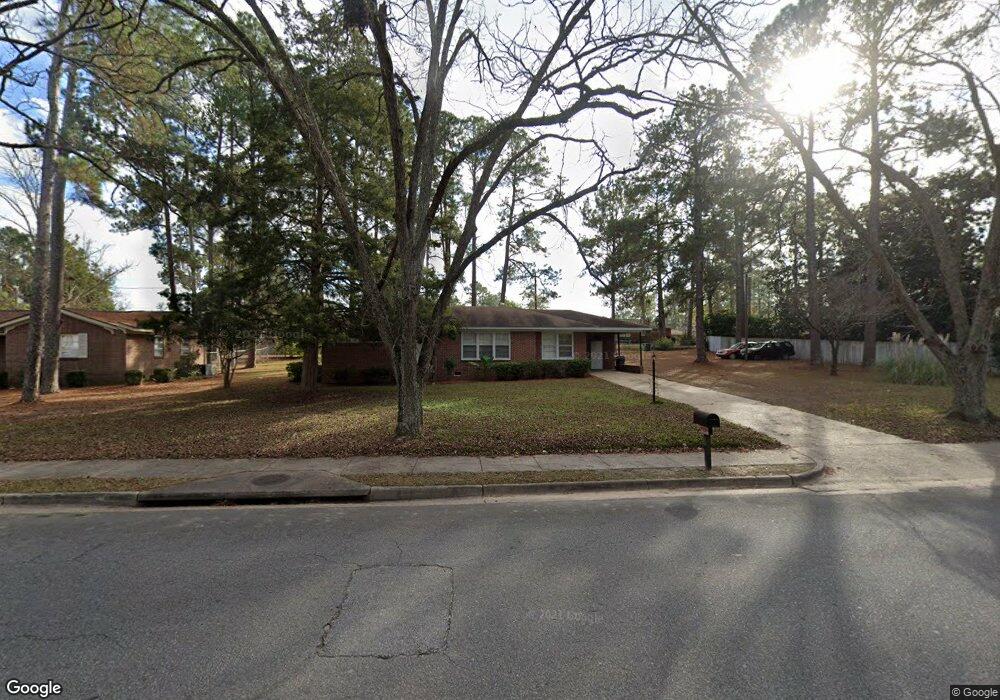
512 E 24th Ave Cordele, GA 31015
Estimated Value: $142,537 - $169,000
3
Beds
2
Baths
1,364
Sq Ft
$113/Sq Ft
Est. Value
About This Home
This home is located at 512 E 24th Ave, Cordele, GA 31015 and is currently estimated at $154,634, approximately $113 per square foot. 512 E 24th Ave is a home located in Crisp County with nearby schools including Crisp County Elementary School, Crisp County Primary School, and Crisp County Middle School.
Ownership History
Date
Name
Owned For
Owner Type
Purchase Details
Closed on
Aug 31, 2021
Sold by
Gsa Properties Llc
Bought by
Williams Ivan A
Current Estimated Value
Purchase Details
Closed on
Feb 28, 2013
Sold by
Dennard Jerry
Bought by
Gsa Properties Llc
Purchase Details
Closed on
Jan 1, 2012
Sold by
Dennard Jerry and Dennard Sylvia
Bought by
Dennard Jerry and Dennard Sylvia
Purchase Details
Closed on
Jan 1, 2011
Sold by
Dennard Jerry and Dennard Sylvi
Bought by
Dennard Jerry and Dennard Sylvia
Purchase Details
Closed on
Feb 26, 1991
Bought by
Dennard Jerry and Dennard Sylvi
Purchase Details
Closed on
Dec 5, 1957
Bought by
Jackson J A
Create a Home Valuation Report for This Property
The Home Valuation Report is an in-depth analysis detailing your home's value as well as a comparison with similar homes in the area
Home Values in the Area
Average Home Value in this Area
Purchase History
| Date | Buyer | Sale Price | Title Company |
|---|---|---|---|
| Williams Ivan A | $90,000 | -- | |
| Gsa Properties Llc | $76,000 | -- | |
| Dennard Jerry | $82,500 | -- | |
| Dennard Jerry | $87,500 | -- | |
| Dennard Jerry | $50,000 | -- | |
| Jackson J A | -- | -- |
Source: Public Records
Tax History Compared to Growth
Tax History
| Year | Tax Paid | Tax Assessment Tax Assessment Total Assessment is a certain percentage of the fair market value that is determined by local assessors to be the total taxable value of land and additions on the property. | Land | Improvement |
|---|---|---|---|---|
| 2024 | $1,661 | $46,352 | $6,000 | $40,352 |
| 2023 | $1,544 | $41,182 | $3,000 | $38,182 |
| 2022 | $952 | $39,012 | $3,000 | $36,012 |
| 2021 | $1,164 | $29,800 | $3,000 | $26,800 |
| 2020 | $839 | $29,800 | $3,000 | $26,800 |
| 2019 | $845 | $29,800 | $3,000 | $26,800 |
| 2018 | $888 | $30,127 | $4,800 | $25,327 |
| 2017 | $1,223 | $30,127 | $4,800 | $25,327 |
| 2016 | $891 | $30,127 | $4,800 | $25,327 |
| 2015 | -- | $30,127 | $4,800 | $25,327 |
| 2014 | -- | $30,127 | $4,800 | $25,327 |
| 2013 | -- | $30,127 | $4,800 | $25,327 |
Source: Public Records
Map
Nearby Homes