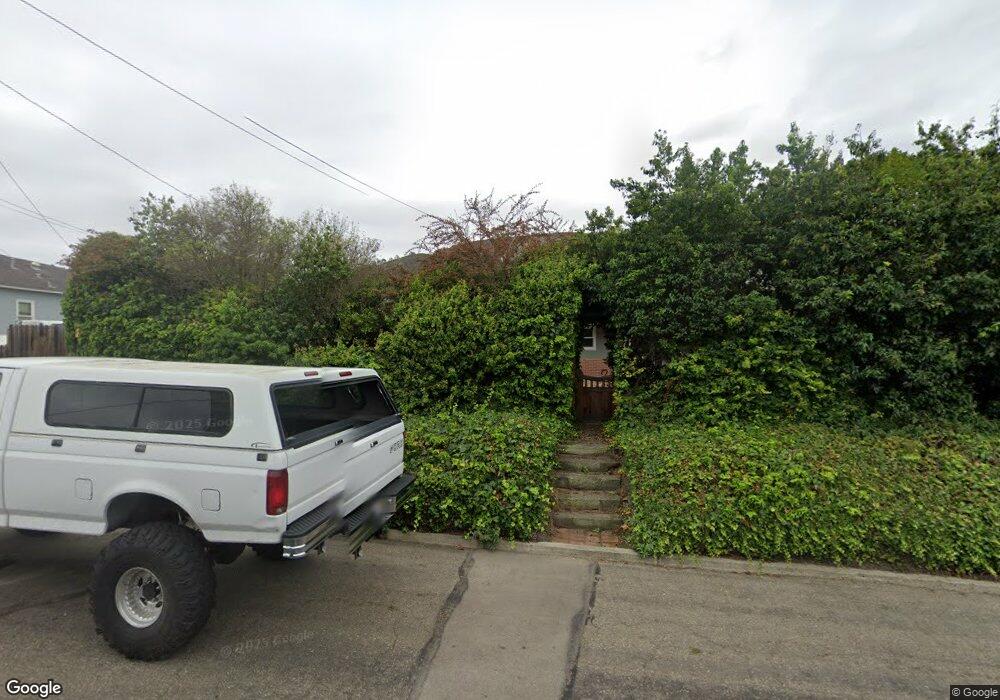
512 E Locust Ave Lompoc, CA 93436
Estimated Value: $655,000 - $702,884
4
Beds
3
Baths
2,362
Sq Ft
$284/Sq Ft
Est. Value
About This Home
This home is located at 512 E Locust Ave, Lompoc, CA 93436 and is currently estimated at $671,471, approximately $284 per square foot. 512 E Locust Ave is a home located in Santa Barbara County with nearby schools including Arthur Hapgood Elementary School, Lompoc Valley Middle School, and Lompoc High School.
Ownership History
Date
Name
Owned For
Owner Type
Purchase Details
Closed on
Sep 16, 2022
Sold by
Lompoc Valley Medical Center
Bought by
Fielding Tyler and Szalay Kari
Current Estimated Value
Home Financials for this Owner
Home Financials are based on the most recent Mortgage that was taken out on this home.
Original Mortgage
$456,000
Outstanding Balance
$435,232
Interest Rate
5.13%
Mortgage Type
New Conventional
Estimated Equity
$236,239
Purchase Details
Closed on
Jan 26, 2022
Sold by
Kaye Lena
Bought by
Lompoc Valley Medical Center
Purchase Details
Closed on
Aug 10, 2021
Sold by
Lena Kaye
Bought by
Kaye Lena
Purchase Details
Closed on
Feb 29, 2012
Sold by
Kappler W Lena
Bought by
Kaye Lena
Create a Home Valuation Report for This Property
The Home Valuation Report is an in-depth analysis detailing your home's value as well as a comparison with similar homes in the area
Home Values in the Area
Average Home Value in this Area
Purchase History
| Date | Buyer | Sale Price | Title Company |
|---|---|---|---|
| Fielding Tyler | $570,000 | Chicago Title | |
| Lompoc Valley Medical Center | -- | None Listed On Document | |
| Kaye Lena | -- | -- | |
| Kaye Lena | -- | None Available |
Source: Public Records
Mortgage History
| Date | Status | Borrower | Loan Amount |
|---|---|---|---|
| Open | Fielding Tyler | $456,000 |
Source: Public Records
Tax History
| Year | Tax Paid | Tax Assessment Tax Assessment Total Assessment is a certain percentage of the fair market value that is determined by local assessors to be the total taxable value of land and additions on the property. | Land | Improvement |
|---|---|---|---|---|
| 2025 | $6,443 | $593,028 | $208,080 | $384,948 |
| 2023 | $6,443 | $570,000 | $200,000 | $370,000 |
| 2022 | $49 | $418,200 | $132,600 | $285,600 |
| 2021 | $1,071 | $95,287 | $22,717 | $72,570 |
| 2020 | $1,060 | $94,311 | $22,485 | $71,826 |
| 2019 | $1,040 | $92,463 | $22,045 | $70,418 |
| 2018 | $1,022 | $90,651 | $21,613 | $69,038 |
| 2017 | $1,001 | $88,875 | $21,190 | $67,685 |
| 2016 | $981 | $87,133 | $20,775 | $66,358 |
| 2014 | $958 | $84,145 | $20,063 | $64,082 |
Source: Public Records
Map
Nearby Homes
Your Personal Tour Guide
Ask me questions while you tour the home.