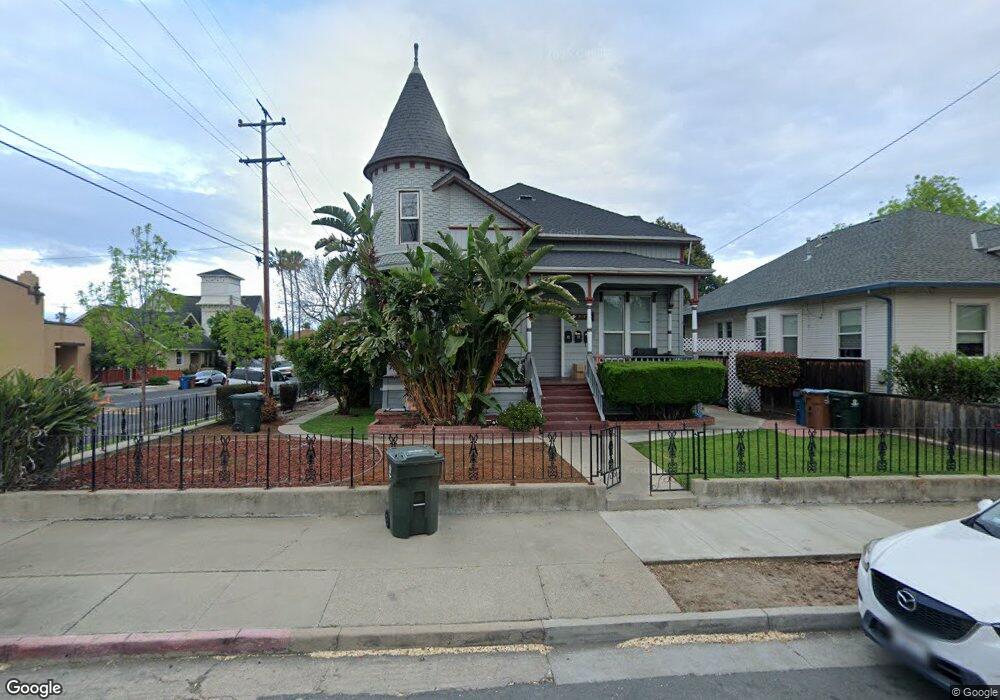
512 E St Unit A Antioch, CA 94509
North Antioch NeighborhoodEstimated Value: $748,000 - $795,932
6
Beds
3
Baths
3,185
Sq Ft
$243/Sq Ft
Est. Value
About This Home
This home is located at 512 E St Unit A, Antioch, CA 94509 and is currently estimated at $774,311, approximately $243 per square foot. 512 E St Unit A is a home located in Contra Costa County with nearby schools including Fremont Elementary School, Antioch Middle School, and Antioch High School.
Ownership History
Date
Name
Owned For
Owner Type
Purchase Details
Closed on
Jun 20, 2018
Sold by
Ap & H Inc
Bought by
M S R Rental Properties Llc
Current Estimated Value
Purchase Details
Closed on
Jul 6, 2015
Sold by
Anka Behavioral Health Inc
Bought by
Ap & H Inc
Purchase Details
Closed on
Jan 25, 2008
Sold by
Phoenix Programs Inc
Bought by
Anka Behavioral Health Inc
Purchase Details
Closed on
Sep 29, 1999
Sold by
Leoppard William M and Leoppard Virginia
Bought by
Phoenix Programs Inc
Home Financials for this Owner
Home Financials are based on the most recent Mortgage that was taken out on this home.
Original Mortgage
$226,772
Interest Rate
7.76%
Mortgage Type
FHA
Create a Home Valuation Report for This Property
The Home Valuation Report is an in-depth analysis detailing your home's value as well as a comparison with similar homes in the area
Home Values in the Area
Average Home Value in this Area
Purchase History
| Date | Buyer | Sale Price | Title Company |
|---|---|---|---|
| M S R Rental Properties Llc | $625,000 | Chicago Title Company | |
| Ap & H Inc | $292,500 | None Available | |
| Anka Behavioral Health Inc | -- | None Available | |
| Phoenix Programs Inc | $200,000 | North American Title Co |
Source: Public Records
Mortgage History
| Date | Status | Borrower | Loan Amount |
|---|---|---|---|
| Previous Owner | Phoenix Programs Inc | $226,772 |
Source: Public Records
Tax History
| Year | Tax Paid | Tax Assessment Tax Assessment Total Assessment is a certain percentage of the fair market value that is determined by local assessors to be the total taxable value of land and additions on the property. | Land | Improvement |
|---|---|---|---|---|
| 2025 | $9,616 | $711,139 | $256,009 | $455,130 |
| 2024 | $9,091 | $697,196 | $250,990 | $446,206 |
| 2023 | $9,091 | $683,526 | $246,069 | $437,457 |
| 2022 | $8,959 | $670,125 | $241,245 | $428,880 |
| 2021 | $8,607 | $656,986 | $236,515 | $420,471 |
| 2019 | $8,470 | $637,500 | $229,500 | $408,000 |
| 2018 | $4,599 | $304,317 | $83,232 | $221,085 |
| 2017 | $4,461 | $298,350 | $81,600 | $216,750 |
| 2016 | $4,336 | $292,500 | $80,000 | $212,500 |
| 2015 | $1,030 | $292,330 | $77,491 | $214,839 |
| 2014 | $973 | $255,000 | $67,500 | $187,500 |
Source: Public Records
Map
Nearby Homes
Your Personal Tour Guide
Ask me questions while you tour the home.