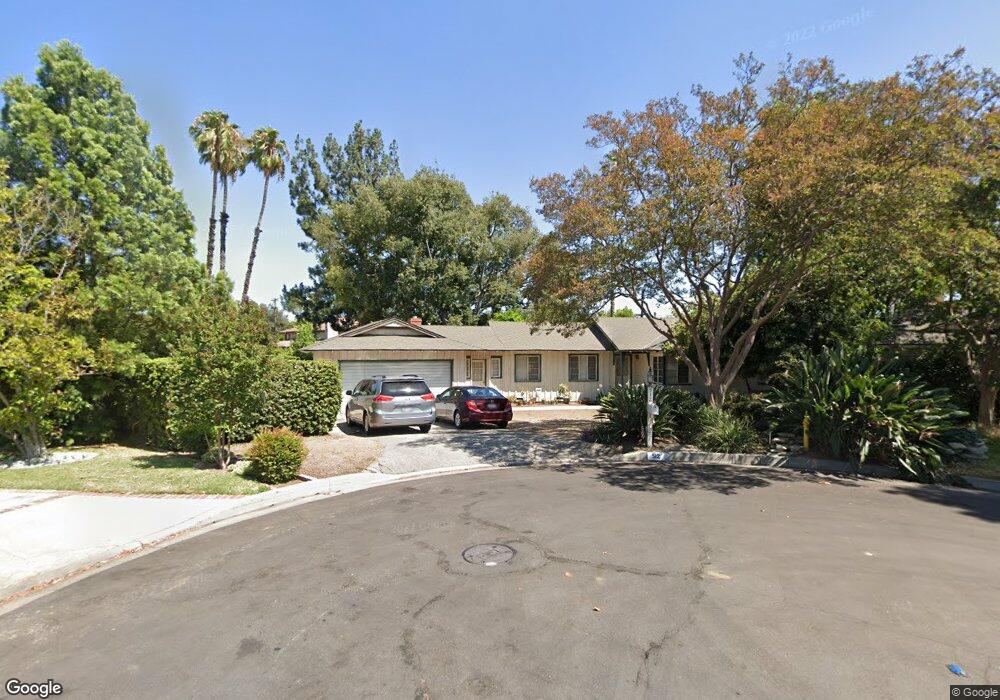
512 E Wistaria Ave Arcadia, CA 91006
Estimated Value: $1,262,632 - $1,411,000
3
Beds
2
Baths
1,495
Sq Ft
$909/Sq Ft
Est. Value
About This Home
This home is located at 512 E Wistaria Ave, Arcadia, CA 91006 and is currently estimated at $1,358,658, approximately $908 per square foot. 512 E Wistaria Ave is a home located in Los Angeles County with nearby schools including Camino Grove Elementary School, Richard Henry Dana Middle School, and Arcadia High School.
Ownership History
Date
Name
Owned For
Owner Type
Purchase Details
Closed on
Nov 16, 2016
Sold by
Sauber Thomas J and Sauber Francesca S
Bought by
Sauber Thomas James and Sauber Francesca Swift
Current Estimated Value
Purchase Details
Closed on
Jul 14, 1998
Sold by
Tyree Pearl
Bought by
Tyree Vance C
Home Financials for this Owner
Home Financials are based on the most recent Mortgage that was taken out on this home.
Original Mortgage
$90,000
Outstanding Balance
$18,338
Interest Rate
6.95%
Estimated Equity
$1,340,320
Purchase Details
Closed on
Jul 1, 1998
Sold by
Tyree Vance C and The Revocable Trust Of Vance C
Bought by
Sauber Thomas J and Sauber Francesca S
Home Financials for this Owner
Home Financials are based on the most recent Mortgage that was taken out on this home.
Original Mortgage
$90,000
Outstanding Balance
$18,338
Interest Rate
6.95%
Estimated Equity
$1,340,320
Purchase Details
Closed on
Apr 29, 1994
Sold by
Tyree Vance C
Bought by
Tyree Vance C
Create a Home Valuation Report for This Property
The Home Valuation Report is an in-depth analysis detailing your home's value as well as a comparison with similar homes in the area
Home Values in the Area
Average Home Value in this Area
Purchase History
| Date | Buyer | Sale Price | Title Company |
|---|---|---|---|
| Sauber Thomas James | -- | None Available | |
| Tyree Vance C | -- | Southland Title | |
| Sauber Thomas J | $272,500 | Southland Title | |
| Tyree Vance C | -- | -- |
Source: Public Records
Mortgage History
| Date | Status | Borrower | Loan Amount |
|---|---|---|---|
| Open | Sauber Thomas J | $90,000 |
Source: Public Records
Tax History
| Year | Tax Paid | Tax Assessment Tax Assessment Total Assessment is a certain percentage of the fair market value that is determined by local assessors to be the total taxable value of land and additions on the property. | Land | Improvement |
|---|---|---|---|---|
| 2025 | $5,355 | $435,093 | $293,149 | $141,944 |
| 2024 | $5,355 | $426,562 | $287,401 | $139,161 |
| 2023 | $5,249 | $418,199 | $281,766 | $136,433 |
| 2022 | $5,087 | $410,000 | $276,242 | $133,758 |
| 2021 | $4,994 | $401,962 | $270,826 | $131,136 |
| 2019 | $4,881 | $382,243 | $262,795 | $119,448 |
| 2018 | $4,627 | $374,749 | $257,643 | $117,106 |
| 2016 | $4,476 | $360,199 | $247,640 | $112,559 |
| 2015 | $4,401 | $354,790 | $243,921 | $110,869 |
| 2014 | $4,350 | $347,841 | $239,143 | $108,698 |
Source: Public Records
Map
Nearby Homes
- 521 Danimere Ave
- 2114 S 8th Ave
- 1431 S 6th Ave
- 1825 Lee Ave
- 1500 S 3rd Ave
- 151 E Longden Ave
- 2809 Weidermeyer Ave
- 2813 Weidermeyer Ave
- 115 E Arthur Ave
- 2880 Foss Ave
- 2328 Lee Ave
- 448 E Sandra Ave
- 2918 Foss Ave
- 416 Jeffries Ave Unit 60
- 416 Jeffries Ave Unit 84
- 4157 Jasmine Ln
- 1227 S 8th Ave
- 4185 Jasmine Ln
- 4183 Jasmine Ln
- 4181 Jasmine Ln
- 510 E Wistaria Ave
- 515 Danimere Ave
- 515 E Wistaria Ave
- 509 Danimere Ave
- 1921 S 6th Ave
- 502 E Wistaria Ave
- 1925 S 6th Ave
- 509 E Wistaria Ave
- 501 Danimere Ave
- 1915 S 6th Ave
- 501 E Wistaria Ave
- 430 E Wistaria Ave
- 1929 S 6th Ave
- 431 Danimere Ave
- 514 Alster Ave
- 508 Alster Ave
- 431 E Wistaria Ave
- 520 Alster Ave
- 428 E Wistaria Ave
- 500 Alster Ave
Your Personal Tour Guide
Ask me questions while you tour the home.