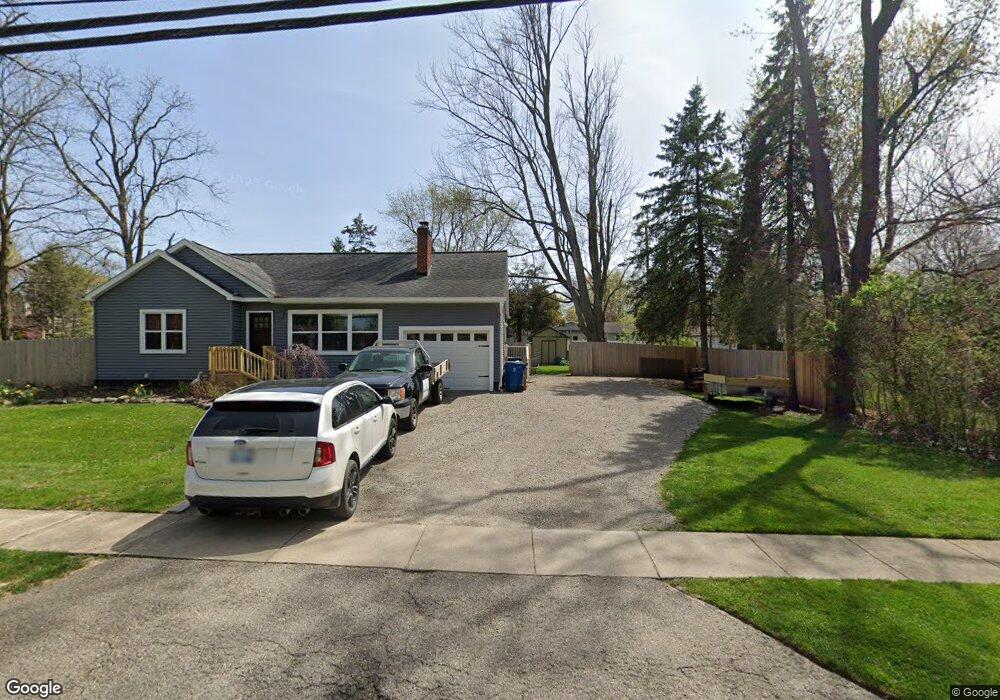
512 Hickory St Linden, MI 48451
Estimated Value: $154,000 - $230,000
2
Beds
1
Bath
896
Sq Ft
$217/Sq Ft
Est. Value
About This Home
This home is located at 512 Hickory St, Linden, MI 48451 and is currently estimated at $194,376, approximately $216 per square foot. 512 Hickory St is a home located in Genesee County with nearby schools including Linden Elementary School, Linden Middle School, and Linden High School.
Ownership History
Date
Name
Owned For
Owner Type
Purchase Details
Closed on
Nov 15, 2011
Sold by
Chatterson Margaret E
Bought by
Fisher Jeffrey E
Current Estimated Value
Purchase Details
Closed on
Jun 4, 2009
Sold by
Chatterson Margaret E
Bought by
Chatterson Margaret E and Fisher Jeffrey Edwin
Home Financials for this Owner
Home Financials are based on the most recent Mortgage that was taken out on this home.
Original Mortgage
$53,040
Interest Rate
4.84%
Mortgage Type
Purchase Money Mortgage
Purchase Details
Closed on
May 12, 2009
Sold by
Whalen Joseph J and Whalen Sara L
Bought by
Chatterson Margaret E
Home Financials for this Owner
Home Financials are based on the most recent Mortgage that was taken out on this home.
Original Mortgage
$53,040
Interest Rate
4.84%
Mortgage Type
Purchase Money Mortgage
Purchase Details
Closed on
Aug 31, 2000
Sold by
Estate Of Idabelle Childs
Bought by
Whalen Joseph J and Whalen Sara L
Create a Home Valuation Report for This Property
The Home Valuation Report is an in-depth analysis detailing your home's value as well as a comparison with similar homes in the area
Home Values in the Area
Average Home Value in this Area
Purchase History
| Date | Buyer | Sale Price | Title Company |
|---|---|---|---|
| Fisher Jeffrey E | -- | Cislo Title Co | |
| Chatterson Margaret E | -- | Cislo Title Co | |
| Chatterson Margaret E | $66,300 | Cislo Title Co | |
| Whalen Joseph J | $94,500 | Metropolitan Title Company |
Source: Public Records
Mortgage History
| Date | Status | Borrower | Loan Amount |
|---|---|---|---|
| Previous Owner | Chatterson Margaret E | $53,040 |
Source: Public Records
Tax History Compared to Growth
Tax History
| Year | Tax Paid | Tax Assessment Tax Assessment Total Assessment is a certain percentage of the fair market value that is determined by local assessors to be the total taxable value of land and additions on the property. | Land | Improvement |
|---|---|---|---|---|
| 2025 | $1,370 | $69,800 | $0 | $0 |
| 2024 | $812 | $67,200 | $0 | $0 |
| 2023 | $829 | $61,500 | $0 | $0 |
| 2022 | $1,252 | $50,800 | $0 | $0 |
| 2021 | $1,090 | $47,100 | $0 | $0 |
| 2020 | $755 | $42,700 | $0 | $0 |
| 2019 | $756 | $37,300 | $0 | $0 |
| 2018 | $1,012 | $37,300 | $0 | $0 |
| 2017 | $981 | $35,900 | $0 | $0 |
| 2016 | $986 | $33,100 | $0 | $0 |
| 2015 | $4,100 | $29,900 | $0 | $0 |
| 2012 | -- | $22,275 | $22,275 | $0 |
Source: Public Records
Map
Nearby Homes
- 214 Willow Ln
- 5202 Amelia Earhart Dr
- 5194 Amelia Earhart Dr
- 337 Creekwood Cir
- 628 Riverside Dr
- 14499 Ripley Rd
- 633 Aldrich St
- 187 Blythe Ave
- 245 Andrea Ave Unit 33
- 4467 Edison Blvd
- 802 Murphy Ct
- 4468 Edison Blvd Unit 50
- 185 Laura Ln Unit 26
- 330 Stan Eaton Dr
- 14238 Durant St
- 331 Andrea Ave Unit 63
- 513 W Broad St
- The Columbia Plan at Liberty Shores
- The Princeton Plan at Liberty Shores
- The Bloomington Plan at Liberty Shores