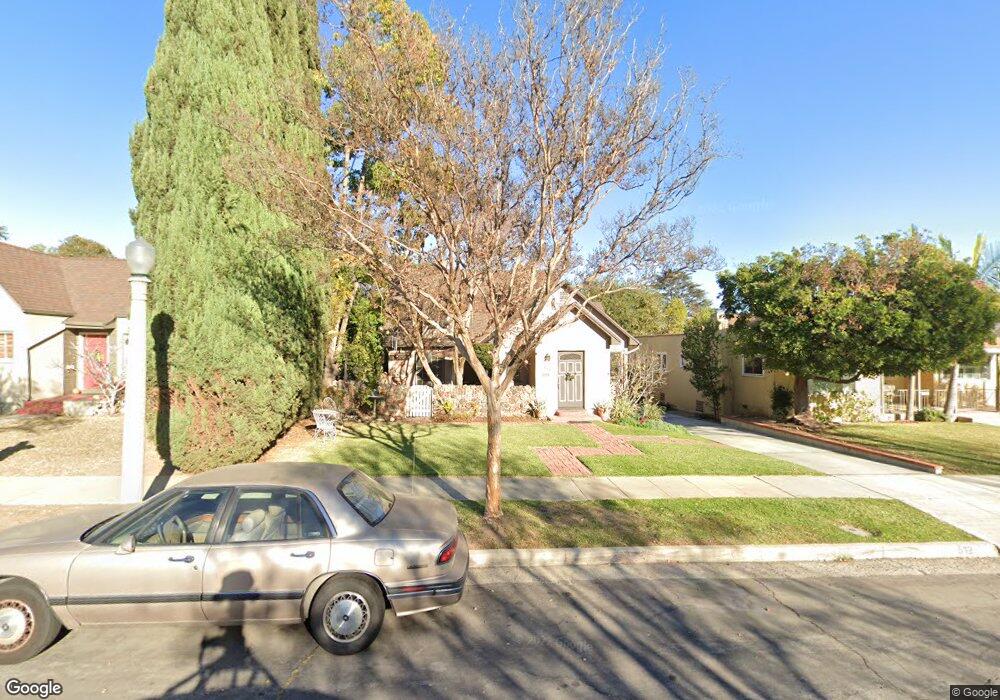
512 N Cordova St Alhambra, CA 91801
Lindaraxa Park NeighborhoodEstimated Value: $1,347,000 - $1,628,000
4
Beds
2
Baths
2,159
Sq Ft
$680/Sq Ft
Est. Value
About This Home
This home is located at 512 N Cordova St, Alhambra, CA 91801 and is currently estimated at $1,468,257, approximately $680 per square foot. 512 N Cordova St is a home located in Los Angeles County with nearby schools including Granada Elementary School, San Gabriel High School, and Options for Youth San Gabriel School.
Ownership History
Date
Name
Owned For
Owner Type
Purchase Details
Closed on
Mar 16, 2021
Sold by
Sells Edward L and Sells Regina I
Bought by
Sells-Cipriani Family Trust and Sells
Current Estimated Value
Purchase Details
Closed on
Jul 11, 2001
Sold by
Sells Edward L
Bought by
Sells Edward L and Cipriani Regina I
Home Financials for this Owner
Home Financials are based on the most recent Mortgage that was taken out on this home.
Original Mortgage
$172,100
Interest Rate
7.21%
Purchase Details
Closed on
Oct 11, 1996
Sold by
Cipriani Regina I
Bought by
Sells Edward L
Home Financials for this Owner
Home Financials are based on the most recent Mortgage that was taken out on this home.
Original Mortgage
$176,000
Interest Rate
8.11%
Create a Home Valuation Report for This Property
The Home Valuation Report is an in-depth analysis detailing your home's value as well as a comparison with similar homes in the area
Home Values in the Area
Average Home Value in this Area
Purchase History
| Date | Buyer | Sale Price | Title Company |
|---|---|---|---|
| Sells-Cipriani Family Trust | -- | None Listed On Document | |
| Sells Edward L | -- | Stewart Title | |
| Sells Edward L | -- | First American | |
| Sells Edward L | $256,000 | First American |
Source: Public Records
Mortgage History
| Date | Status | Borrower | Loan Amount |
|---|---|---|---|
| Previous Owner | Sells Edward L | $172,100 | |
| Previous Owner | Sells Edward L | $176,000 |
Source: Public Records
Tax History Compared to Growth
Tax History
| Year | Tax Paid | Tax Assessment Tax Assessment Total Assessment is a certain percentage of the fair market value that is determined by local assessors to be the total taxable value of land and additions on the property. | Land | Improvement |
|---|---|---|---|---|
| 2025 | $4,936 | $390,861 | $228,005 | $162,856 |
| 2024 | $4,936 | $383,198 | $223,535 | $159,663 |
| 2023 | $4,900 | $375,685 | $219,152 | $156,533 |
| 2022 | $4,672 | $368,319 | $214,855 | $153,464 |
| 2021 | $4,614 | $361,098 | $210,643 | $150,455 |
| 2020 | $4,589 | $357,397 | $208,484 | $148,913 |
| 2019 | $4,455 | $350,391 | $204,397 | $145,994 |
| 2018 | $4,424 | $343,522 | $200,390 | $143,132 |
| 2016 | $4,058 | $330,184 | $192,609 | $137,575 |
| 2015 | $3,997 | $325,225 | $189,716 | $135,509 |
| 2014 | $3,950 | $318,855 | $186,000 | $132,855 |
Source: Public Records
Map
Nearby Homes
- 508 N Hidalgo Ave
- 621 N Granada Ave
- 105 N El Molino St Unit E
- 32 N Almansor St Unit D
- 105 N Almansor St Unit 4
- 333 N Chapel Ave Unit A
- 1116 Lorain Rd
- 210 N Monterey St Unit 208
- 212 N Stoneman Ave Unit E
- 115 S Granada Ave
- 20 S Vega St
- 15 S Chapel Ave Unit C
- 321 Bridge St
- 354 Pasqual Ave
- 116 S Chapel Ave Unit J
- 909 N Stoneman Ave
- 1660 Chelsea Rd
- 900 W Roses Rd
- 925 N Stoneman Ave Unit A
- Plan PB-1 at Monterey Bay Square
- 508 N Cordova St
- 518 N Cordova St
- 504 N Cordova St
- 522 N Cordova St
- 432 N Cordova St
- 806 E Alhambra Rd
- 810 E Alhambra Rd
- 430 N Cordova St
- 505 N Cordova St
- 816 E Alhambra Rd
- 501 N Cordova St
- 509 N Cordova St
- 437 N Cordova St
- 515 N Cordova St
- 424 N Cordova St
- 431 N Cordova St
- 517 N Cordova St
- 521 N Cordova St
- 429 N Cordova St
- 420 N Cordova St